DIFF long strategy: the coin and the market buying together
The idea
DIFF 3B-5A compares buyers within 3% below the price with sellers within 5% above it. DIFF 1.5B-3A does the same closer to the price. When both lines are above zero, buyers near the price outweigh sellers even with extra depth on the sellers' side.
One coin can show that picture by chance. So the same two lines are also checked on TOTAL, the whole Binance spot market. A signal counts only when buyers have the edge in the coin and in the market at the same time.
Setup
You need four BID / ASK panes, one DIFF line each:
| Pane | Coin type | Line |
|---|---|---|
| 1 | COIN | DIFF 3B-5A |
| 2 | COIN | DIFF 1.5B-3A |
| 3 | TOTAL | DIFF 3B-5A |
| 4 | TOTAL | DIFF 1.5B-3A |
These DIFF lines are not in the ready-made list, so you build them:
- Add indicator → BID/ASK. For panes 3 and 4, set Coin type to TOTAL on the Arguments tab.
- On the Style tab, untick BID 3 and ASK 3 so the pane keeps only the line you need.
- At the bottom of the tab, pick BID and ASK (1) and click Add (2). The new line appears in the DIFF list, already ticked (3).
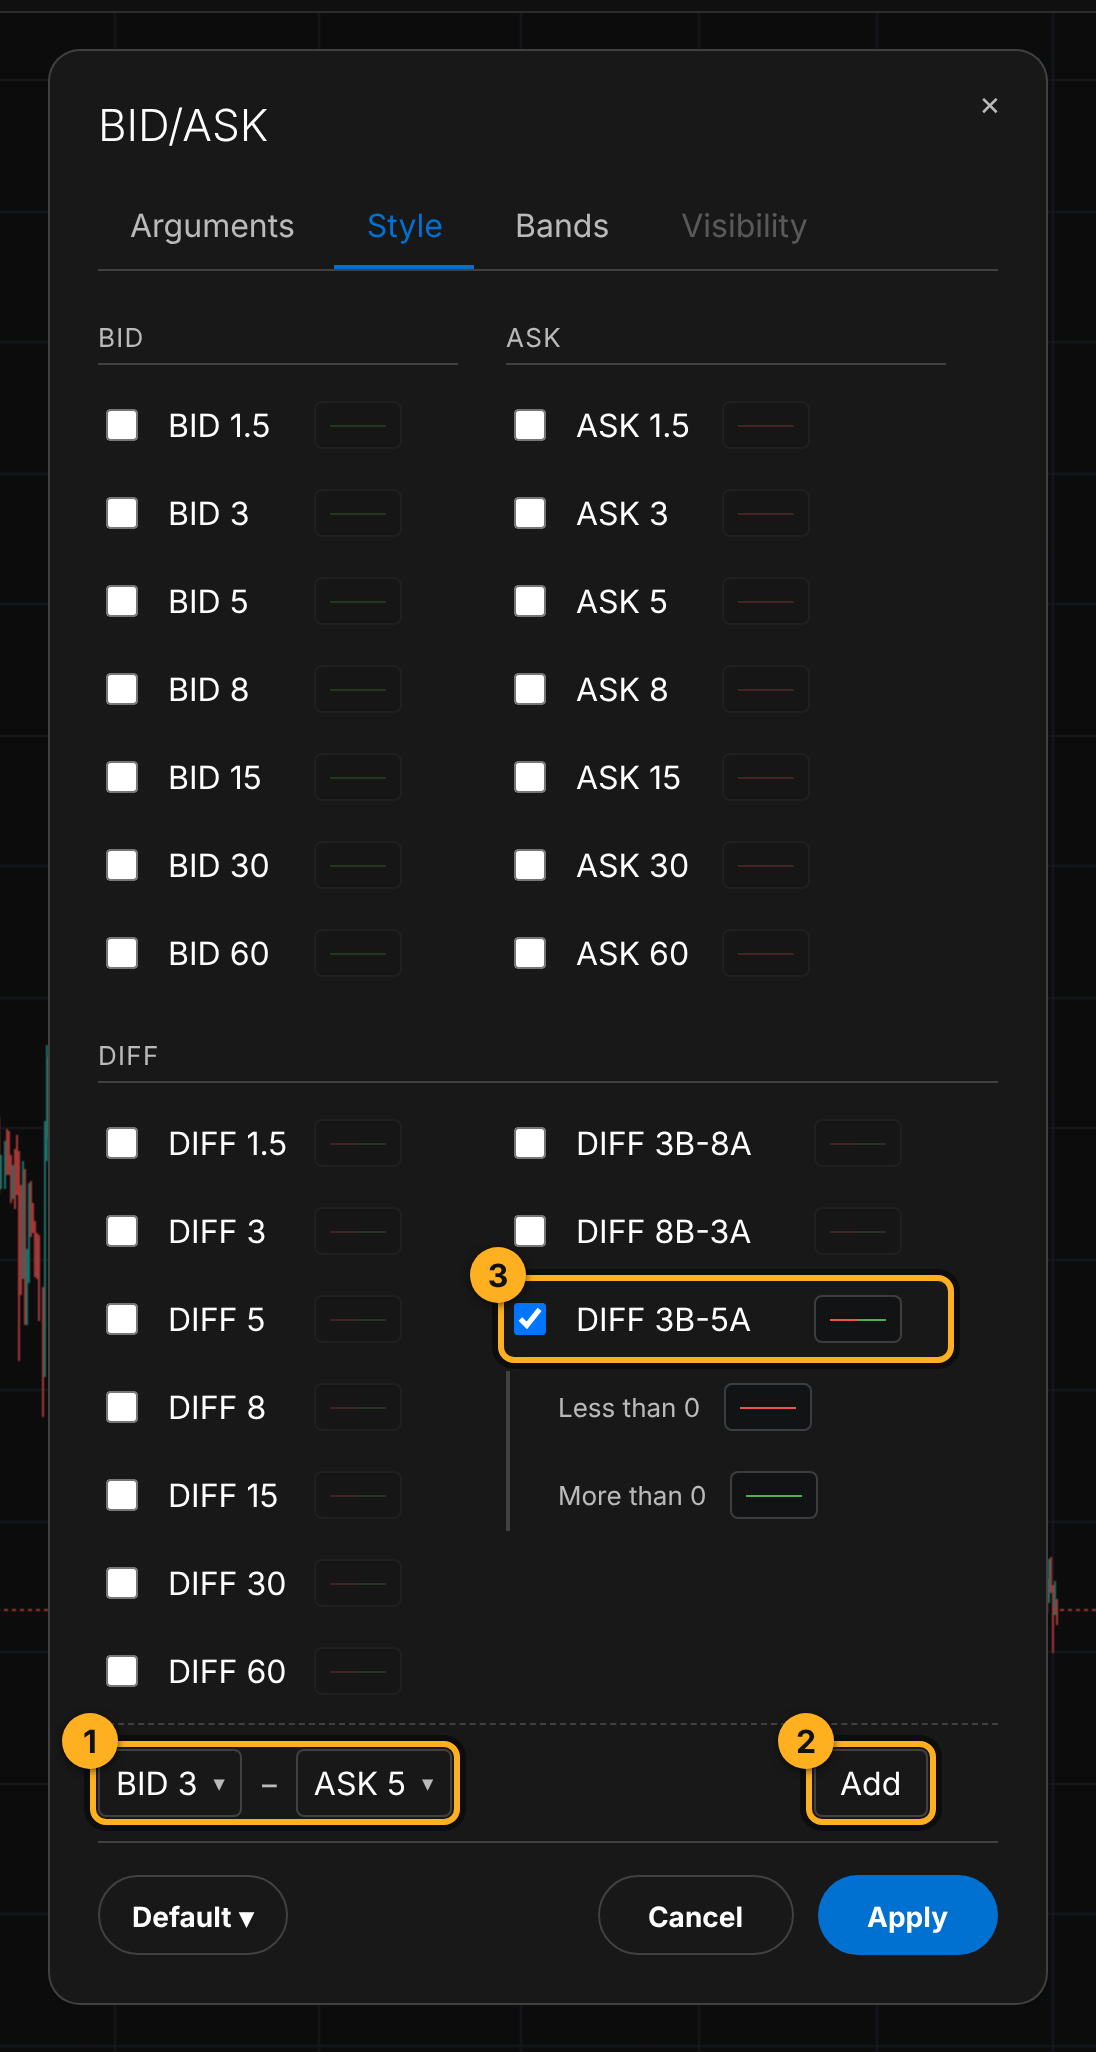
1 Pick the depths, BID 3 and ASK 5. 2 Add adds the line. 3 The new DIFF 3B-5A line, ticked. Below it are its two colours, under zero and over zero. - Click Apply and repeat for the other three panes.
Then add Condition Bands with four conditions. In each, the left side is Difference, the comparison is >, the right side is Number 0:
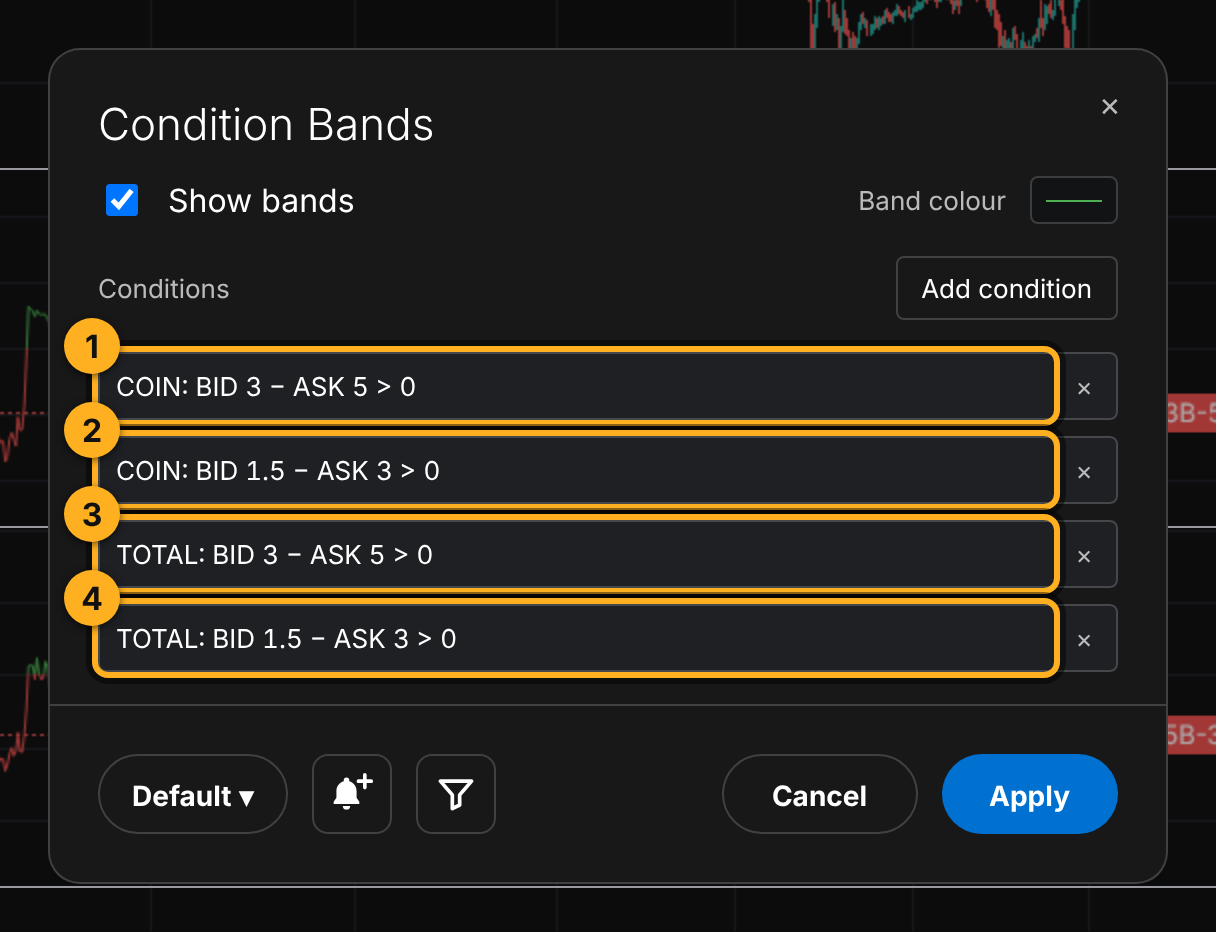
Entry checklist
On a closed candle, check:
- the coin's DIFF 3B-5A is above zero;
- the coin's DIFF 1.5B-3A is above zero;
- the market's (TOTAL) DIFF 3B-5A is above zero;
- the market's (TOTAL) DIFF 1.5B-3A is above zero.
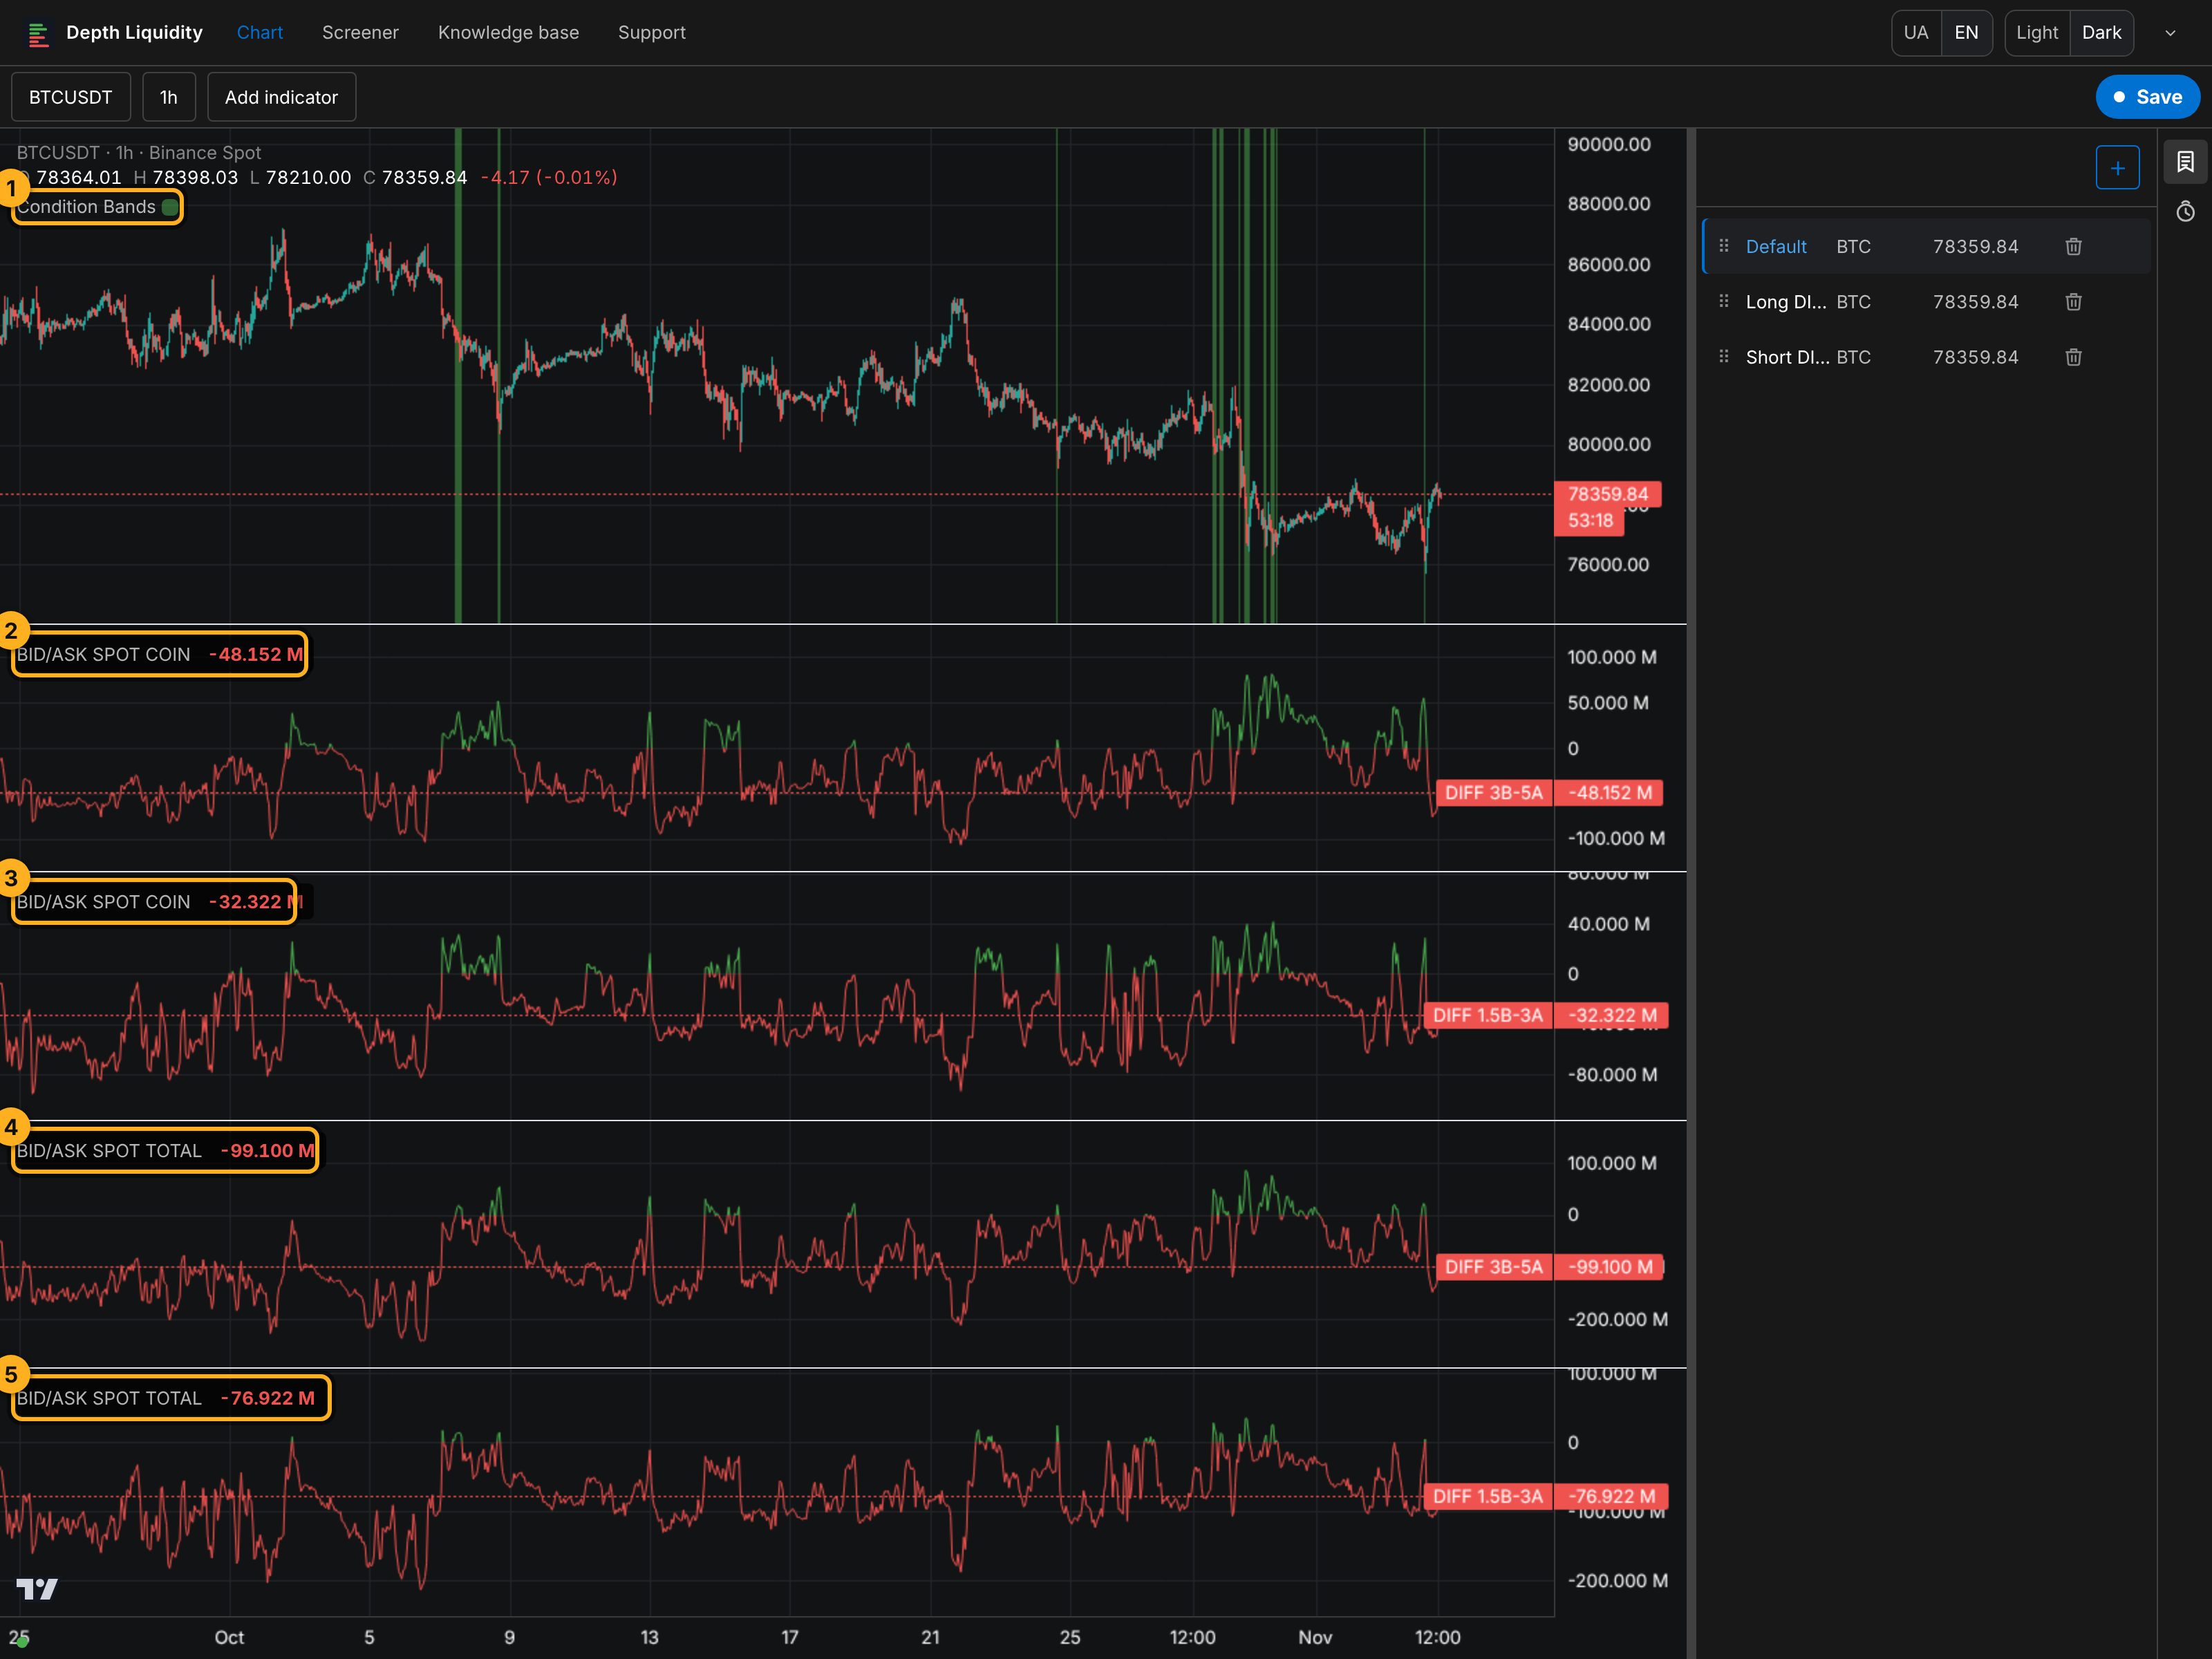
All four together give a green Condition Bands band on the price chart. No band, no signal.
Exit
The strategy describes the entry. The signal ends as soon as any of the four lines drops below zero, and the band on the chart stops. Where to take profit and where to put a stop is your call, based on your own risk.
What it looks like on history
Look at the screenshot above. Over a month on the BTC 1h chart there are few bands: the condition is rare because four lines have to line up at once. After some bands price went up, after others it didn't. Before you use the strategy, go through your own coin and timeframe the same way and count how often a band worked and how often it didn't.
When it doesn't work
- The market drops hard and fast. The book lags the price, and DIFF can still show buyers ahead after price has already gone down.
- A coin with a thin book. One big order flips the coin's DIFF, and the signal turns out to be random.
- A single candle under a band. A lone band often means the condition blinked and vanished. A longer band over several candles is more reliable.
Check it, find coins, get an alert
- Check it on history. Condition Bands already shades every past signal on the chart. Switch the coin and timeframe and look at what price did after the bands.
- Find coins. In the Condition Bands window, click Use in screener. The Screener shows coins where all four conditions hold right now. The TOTAL conditions are the same for every coin, so if the market fails them, the list is empty.
- Get an alert. Create alert in the same window opens a Telegram alert form with these conditions. COIN conditions get the coin open on the chart.
Ready-made preset
To skip building four panes by hand, open the ready-made preset. It loads a chart with all four DIFF panes and Condition Bands set up as in this article. You can switch the coin as usual and the settings stay.
Open on the chartNot financial advice.