Open Interest: how much money is sitting in futures positions
What it shows
Every futures contract has two sides, a buyer and a seller. OI counts how many of those contracts are open right now and converts them to dollars. The data comes from Binance USDⓈ-M perpetual futures, <coin>USDT pairs.
- OI goes up when new money enters positions: someone opened a long, someone opened a short.
- OI goes down when positions are closed, by choice or through liquidation.
On its own, OI doesn't say who is stronger, longs or shorts. It shows how much money is in play.
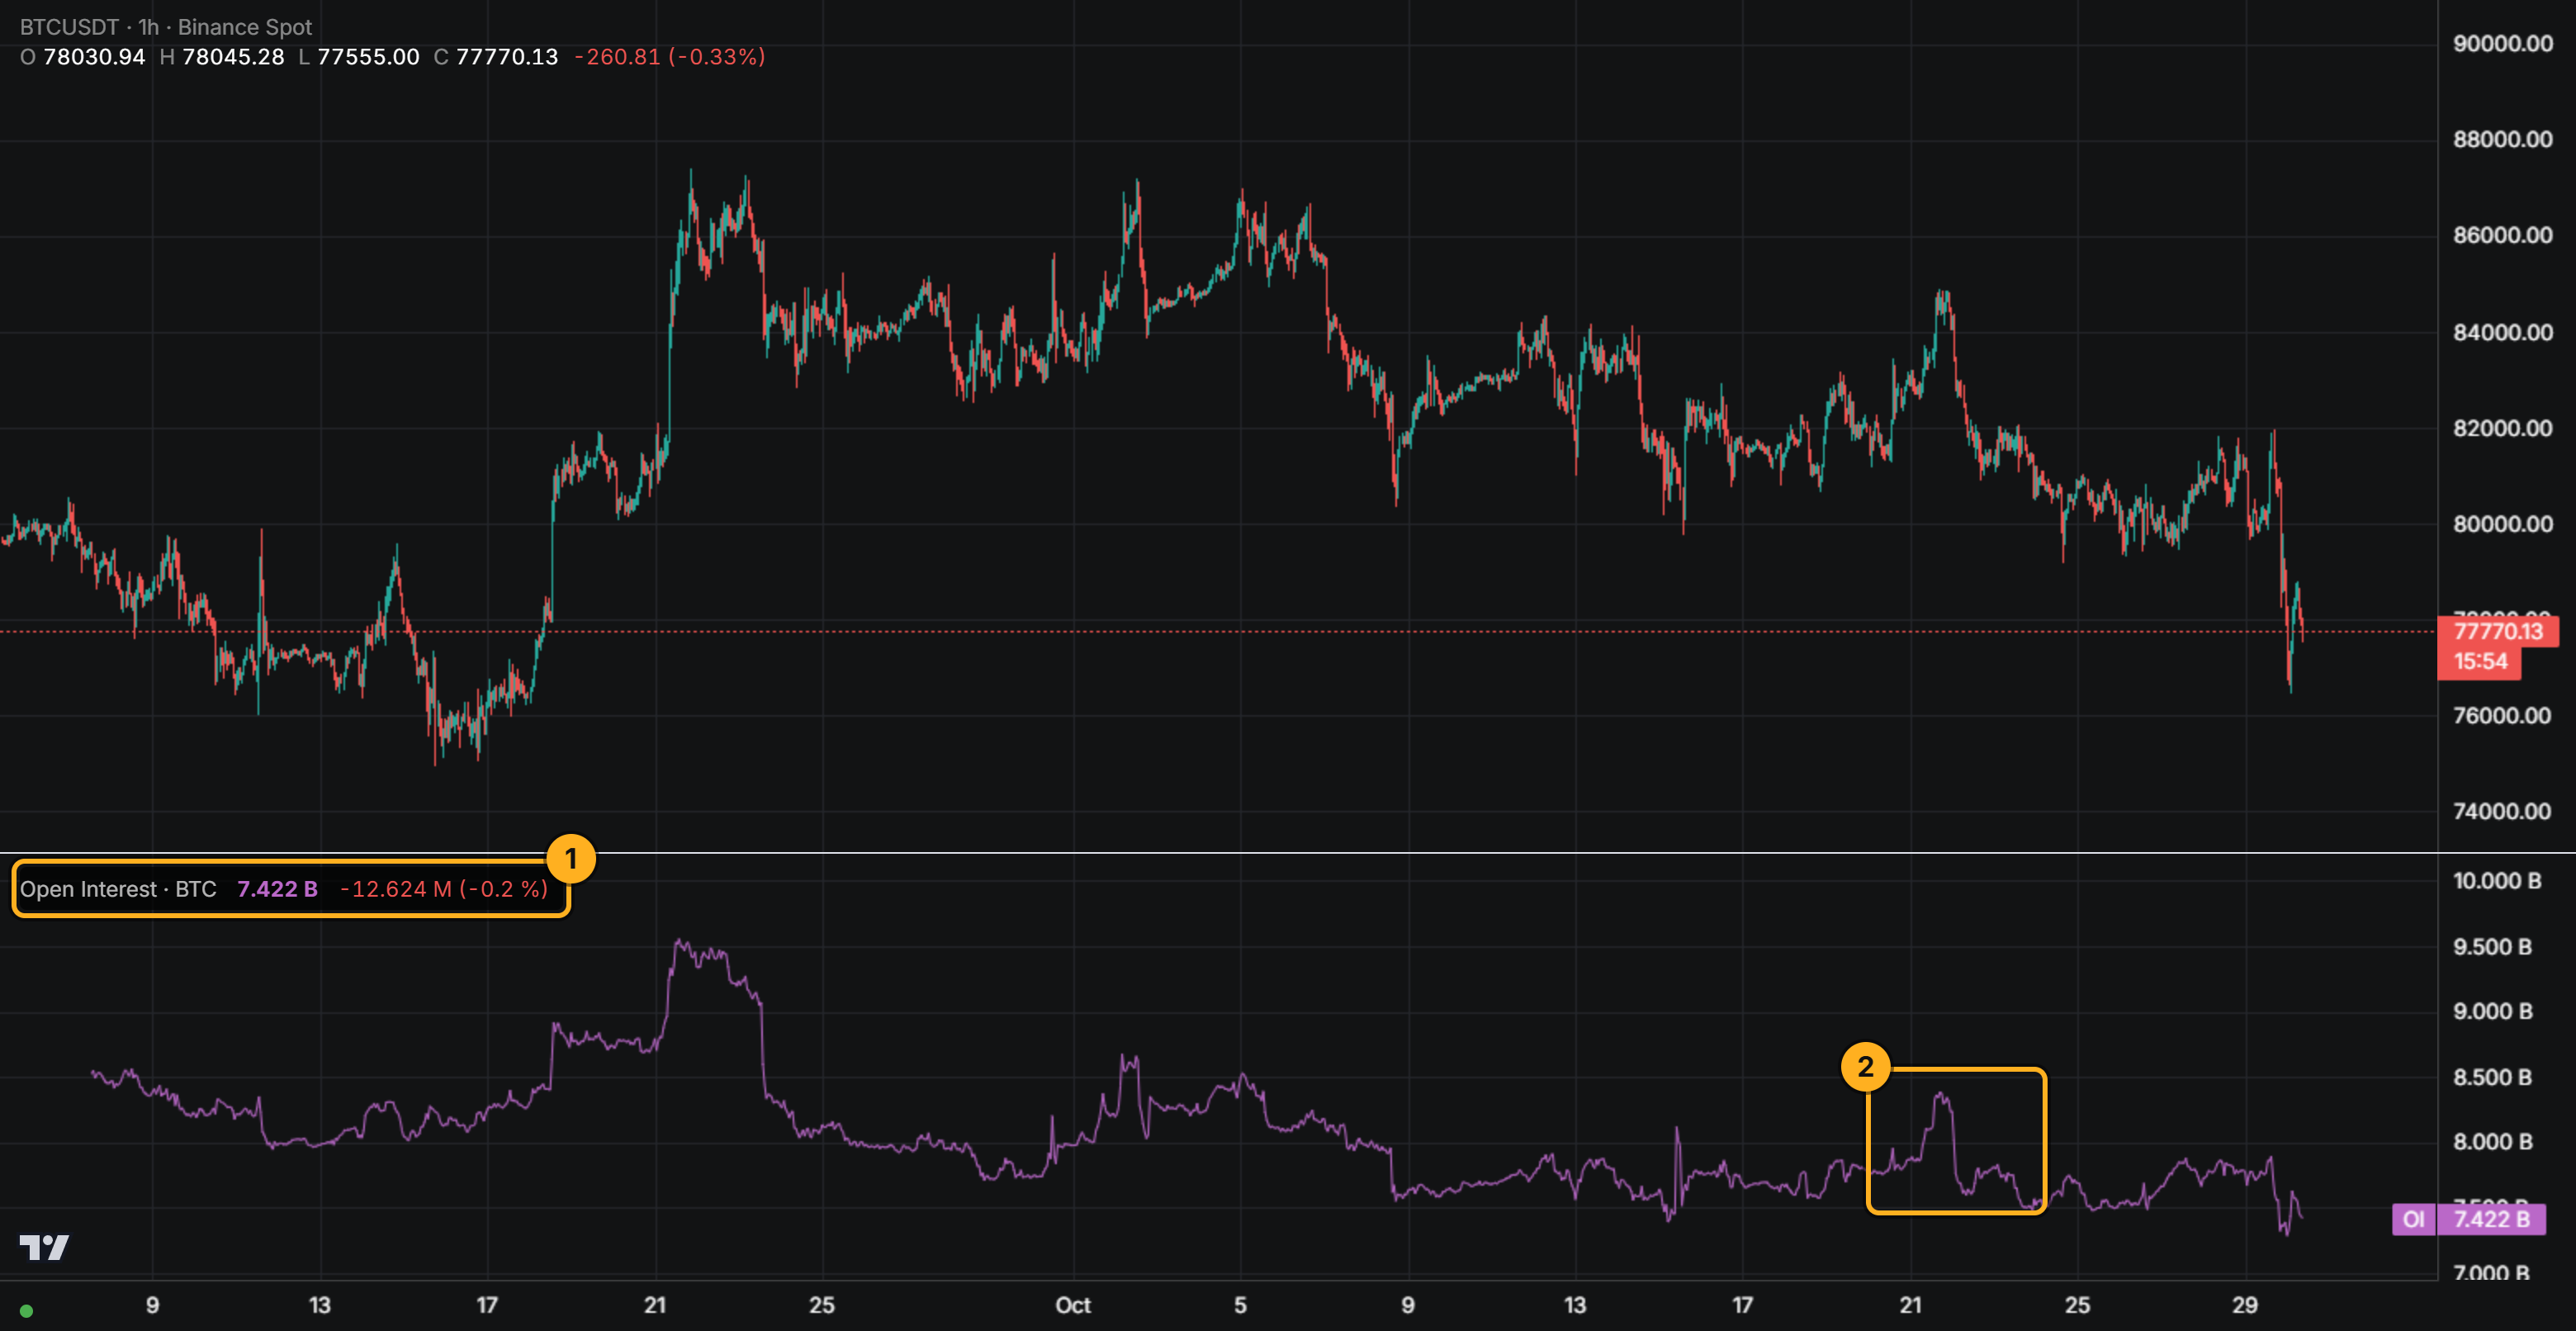
How to add it
- Open Chart and pick a coin.
- Click Add indicator → Open Interest.
- On the Arguments tab, in the Source field, choose what to show: COIN, the chart's coin (default), or TOTAL, the whole futures market.
- On the Style tab, the Plot row sets the colour, thickness and look: line (default), step line, histogram, area, columns or circles.
- Click Apply. The indicator appears in its own pane under the price chart.
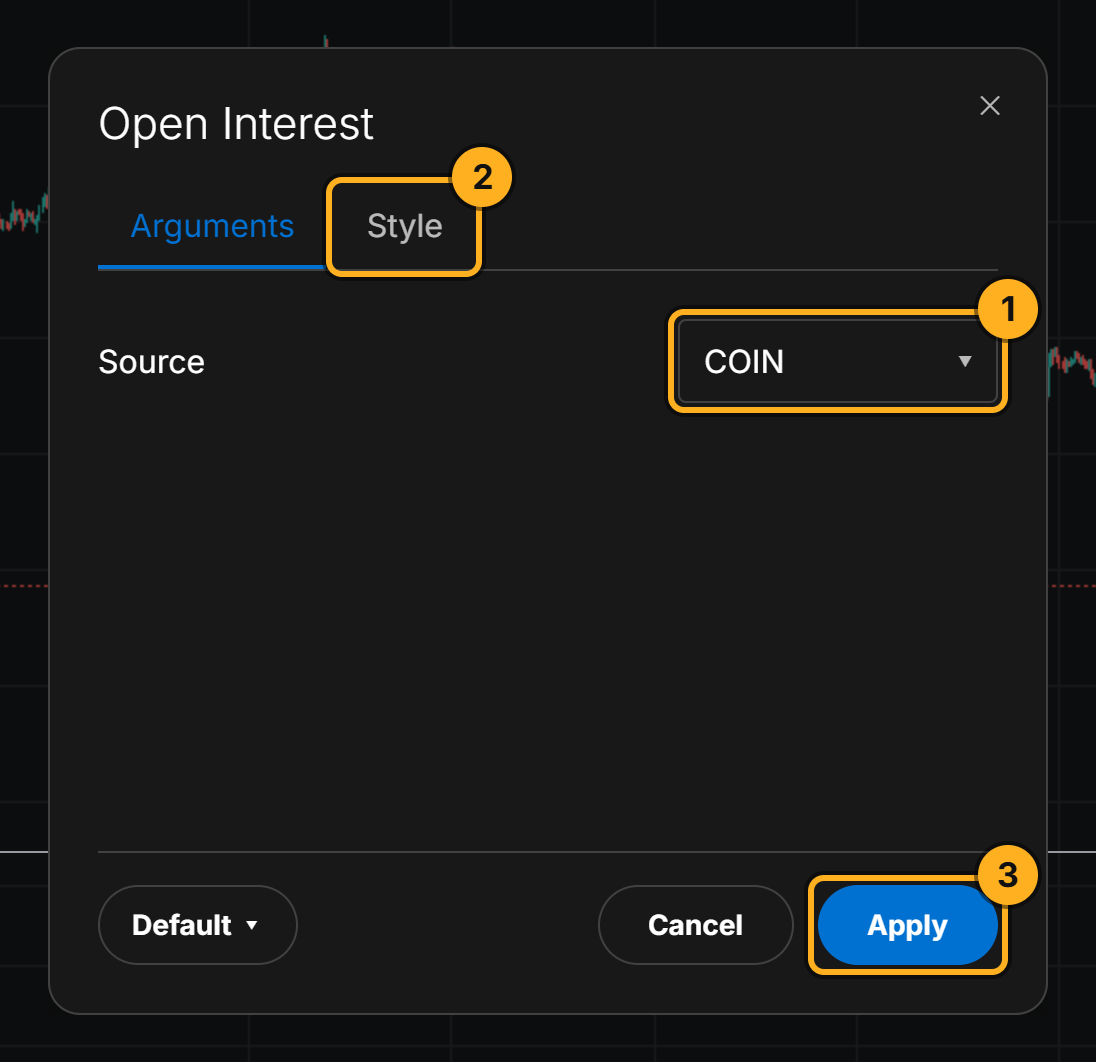
1 The Source field: COIN or TOTAL. 2 The Style tab with the line's look. 3 Apply adds the pane.
Settings
| Setting | Values | What it changes |
|---|---|---|
| Source | COIN (the chart's coin) / TOTAL | One coin or the sum across all futures |
| Plot | line, step line, histogram, area, columns, circles | How the values are drawn |
| Price line | on / off | A horizontal line at the last value |
How it is calculated
- Binance reports OI in 5-minute steps. On 5m and higher timeframes, one candle shows OI at its close, the last value inside the candle. Not an average, not a sum.
- On the 1m timeframe there is nothing finer, so the line moves in 5-minute steps.
- TOTAL is the sum of OI across all coins. Fresh data arrives about 15–20 minutes late, TOTAL a bit later still: it shows up only once every coin is in, so the end of the line never shows a fake dip.
How to read it
OI says the most together with price:
| Price | OI | What it usually means |
|---|---|---|
| up | up | new money is entering, new longs back the move up |
| up | down | short covering drives the move, little new money |
| down | up | new shorts are opening, selling pressure is building |
| down | down | positions are closing, longs are leaving or getting liquidated |
These are common patterns, not rules. Check them on your coin together with the order book in BID / ASK.
A sharp drop in OI
If OI drops hard on one candle, positions closed in bulk. Often that's liquidations: look at liquidations on the same candle.
OI rising while price stands still
Money keeps piling into positions but price goes nowhere. The longer that lasts, the bigger the move can be once one side starts leaving.
Common mistakes
- Comparing OI across coins in dollars. BTC and a small coin are on different scales. Watch how a coin's OI changes against itself.
- Reading OI as direction. OI doesn't say whether it's longs or shorts. Direction only shows together with price.
- Expecting OI on the newest candle. The data lags, so the last point shows up after the price candle.
Try it yourself
- Open BTCUSDT, 1h, add Open Interest for the coin.
- Over a week, find places where price went up. Did OI go up or down at the same time?
- Add another OI pane on TOTAL: does BTC move with the whole market?
Not financial advice.