Liquidations: how many longs and shorts the exchange closed by force
What it shows
A liquidation happens when a leveraged position runs out of margin and the exchange closes it.
- Longs get liquidated when price falls. The position is closed with a sell, which pushes price down further.
- Shorts get liquidated when price rises. The position is closed with a buy, which pushes price up.
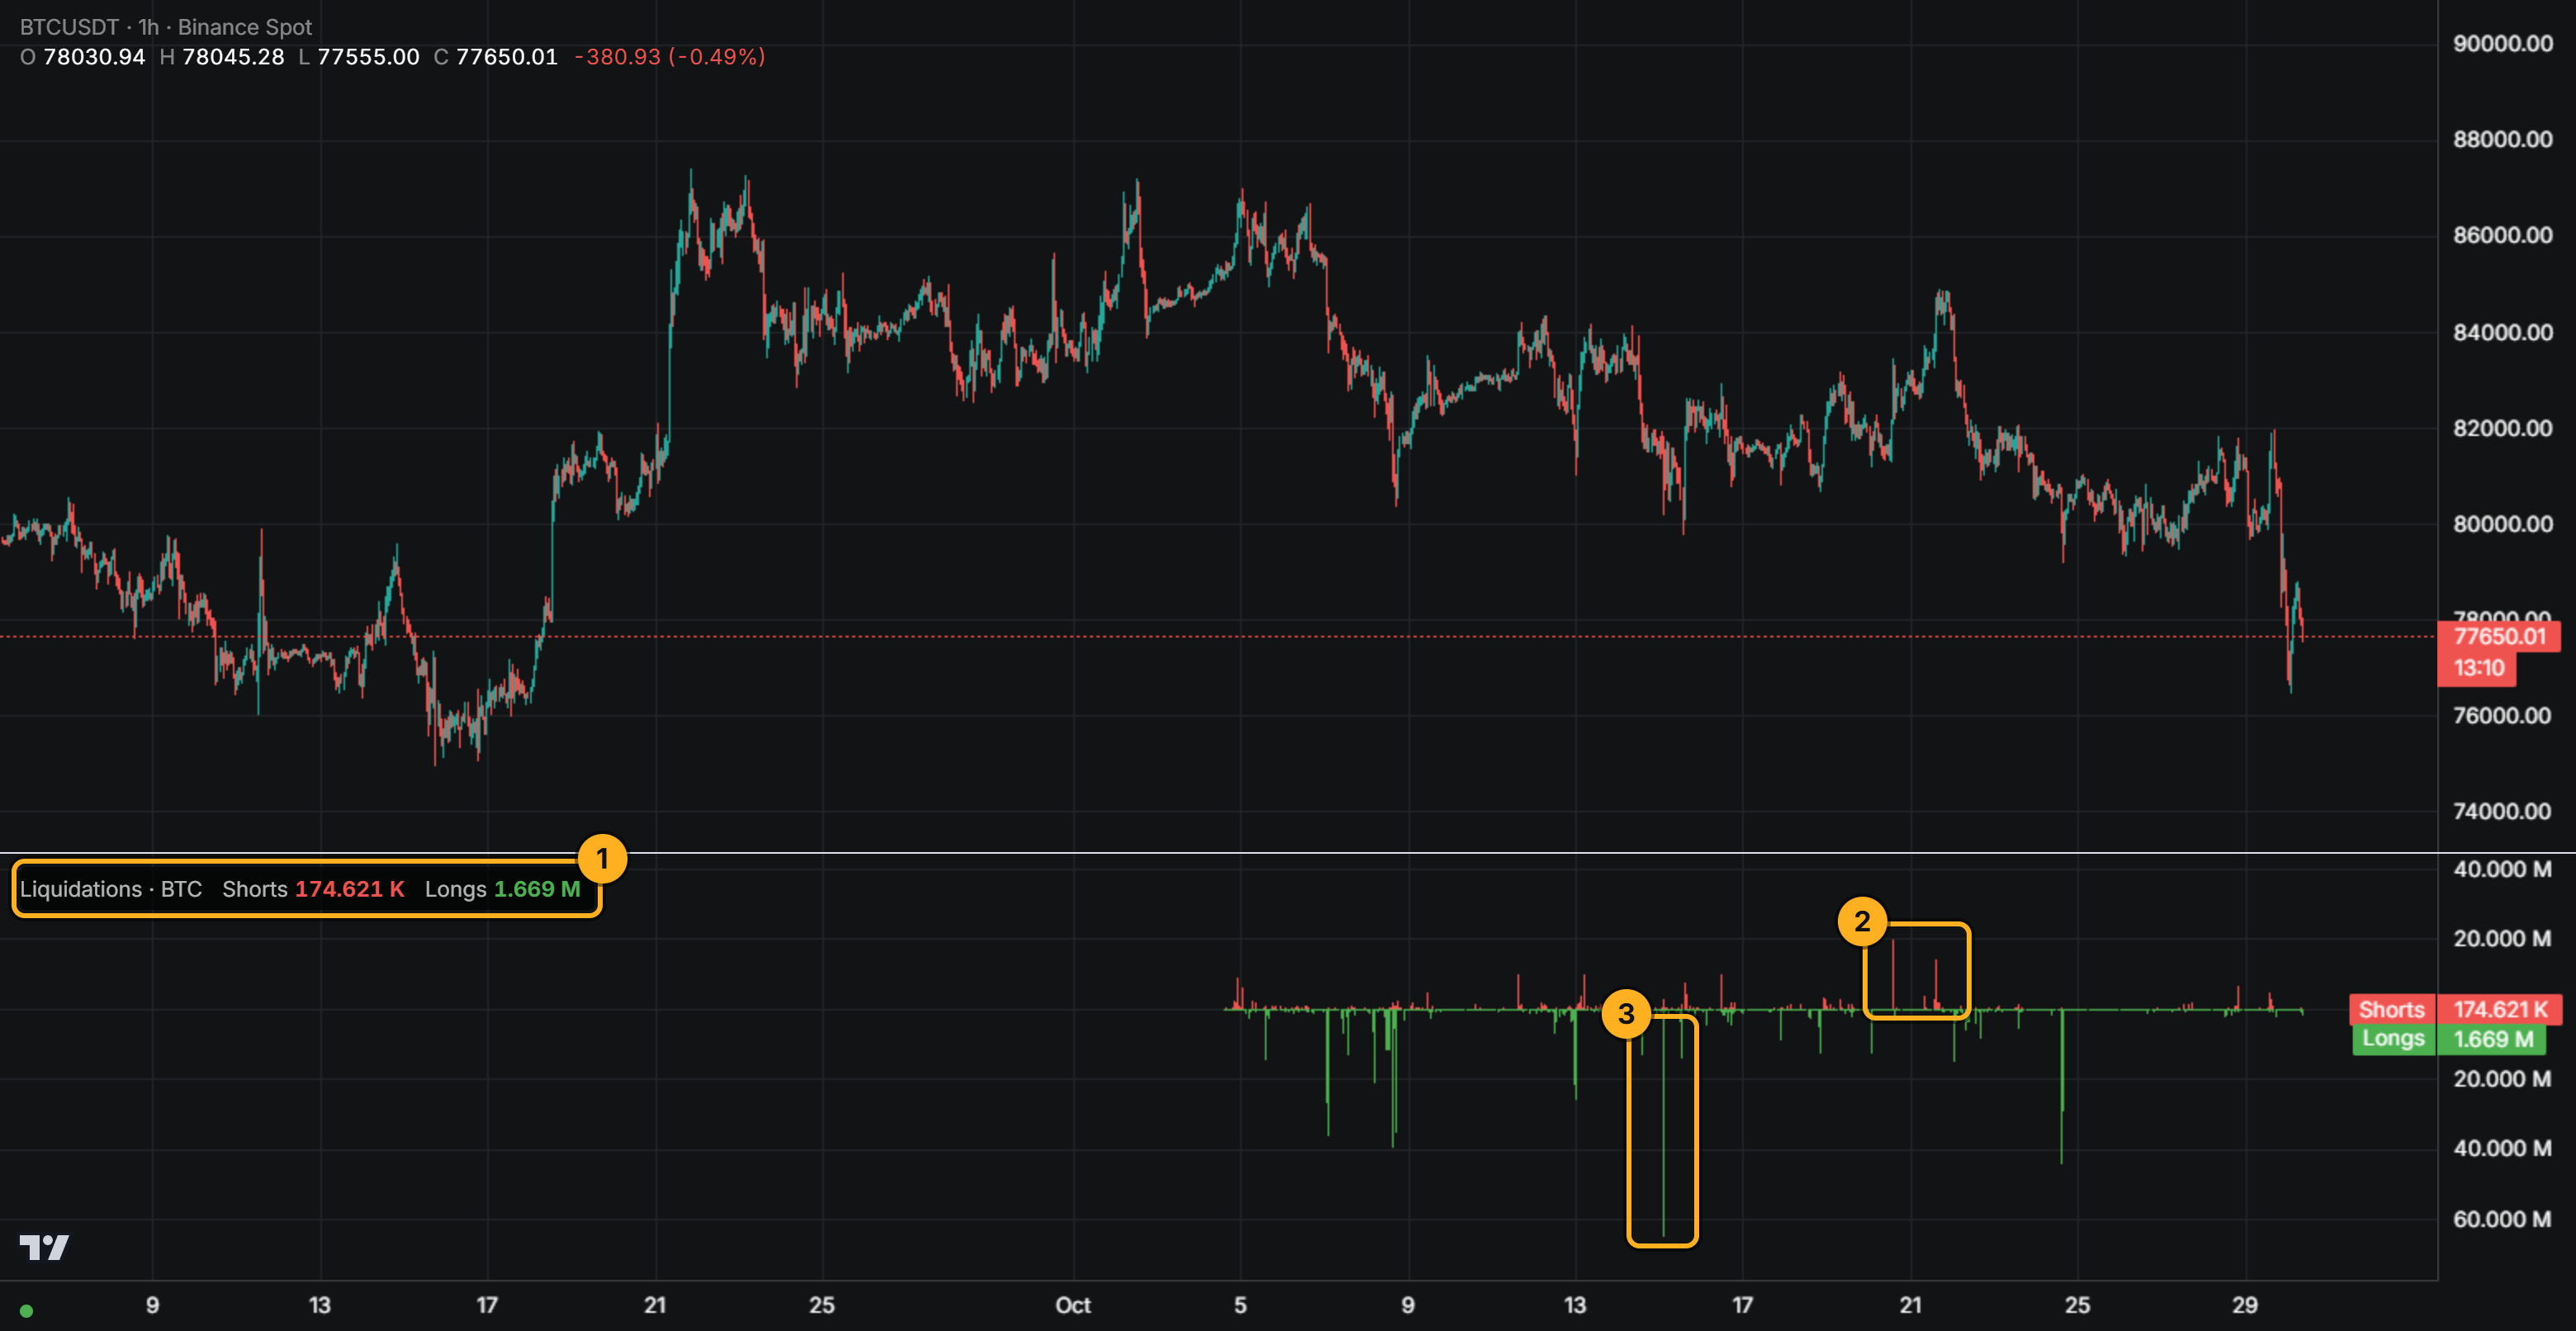
The pane has two mirrored sets of bars. Above zero is the sum of liquidated shorts on the candle, below zero the sum of liquidated longs. A candle with no liquidations stays empty.
If you pick Longs or Shorts in the Side field, only that side stays on the pane. There is no lower half then: the bars grow up from the bottom of the pane, and the legend shows a single row for the chosen side.
How to add it
- Open Chart and pick a coin.
- Click Add indicator → Liquidations.
- On the Arguments tab, the Source field defaults to TOTAL, the sum across the whole futures market. To see only the chart's coin, pick COIN. Below it, the Side field is set to Both. Pick Longs or Shorts to keep one side on the pane.
- On the Style tab you can change the Shorts and Longs colours. Swap sides flips them: longs up, shorts down. It's only there when Side is Both. With one side it's hidden, and the colour stays tied to the side.
- Click Apply. The indicator appears in its own pane under the price chart and updates live. The Side choice is saved in the preset along with the other settings.
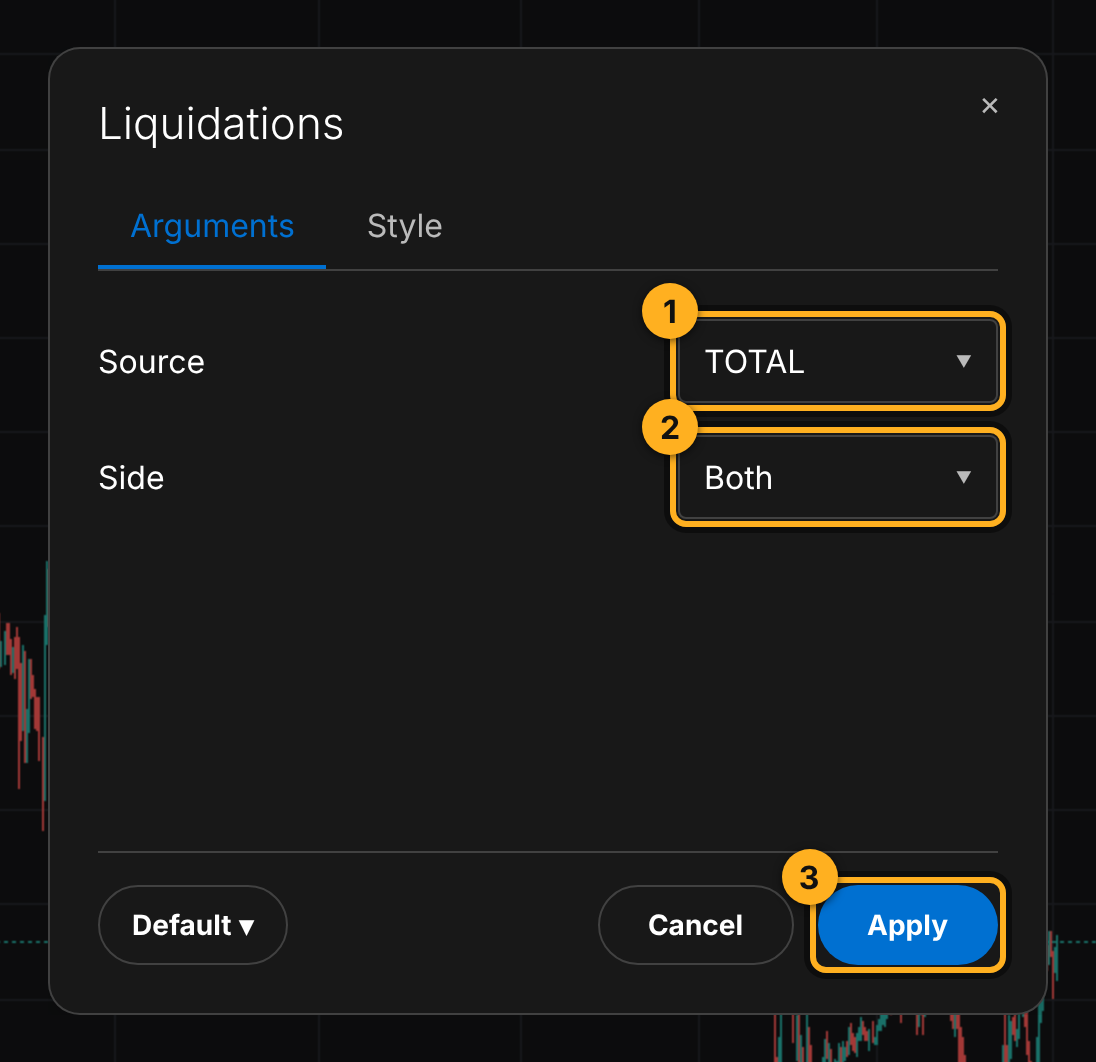
1 The Source field: TOTAL by default, or COIN. 2 The Side field: Both by default, Longs or Shorts. 3 Apply adds the pane.
What to know about the data
- It's a lower bound. Binance reports at most one liquidation per coin per second. When several positions are liquidated within a second, only one makes it into the data, so the real sum can be higher.
- The data comes from Binance USDⓈ-M perpetual futures, sums in dollars (USDT).
How to read it
A big bar down
Longs were closed in bulk. Price most likely dropped hard, and the forced selling pushed it further. After a spike like this, some of the leveraged buyers are already out of the market.
A big bar up
Shorts were closed in bulk: price jumped, and the forced buying added to the move.
A spike together with an OI drop
If Open Interest drops sharply on the same candle, positions really left the market rather than changing hands.
Quiet
Several candles with no bars mean price didn't reach the levels where leveraged positions get liquidated.
Common mistakes
- Comparing sums across coins. $1M of liquidations is routine for BTC and an event for a small coin. Compare a coin with itself.
- Treating the sum as exact. Because of Binance's limit it's a lower bound, and the undercount is largest in the busiest seconds.
Try it yourself
- Open BTCUSDT, 1h, add liquidations and pick COIN.
- Find the biggest bar down over a week. What did price do on that candle and after it?
- Switch to TOTAL: do BTC's spikes line up with the whole market's?
- Open a small coin with COIN and set Side to Longs, then to Shorts. The whole scale now goes to one side, so small liquidations don't get lost next to big spikes on the other side.
Not financial advice.