BID / ASK: how much money is waiting in the book near the price
What it shows
Candles show where price has been. The order book shows who is waiting for it: buyers below the price, sellers above.
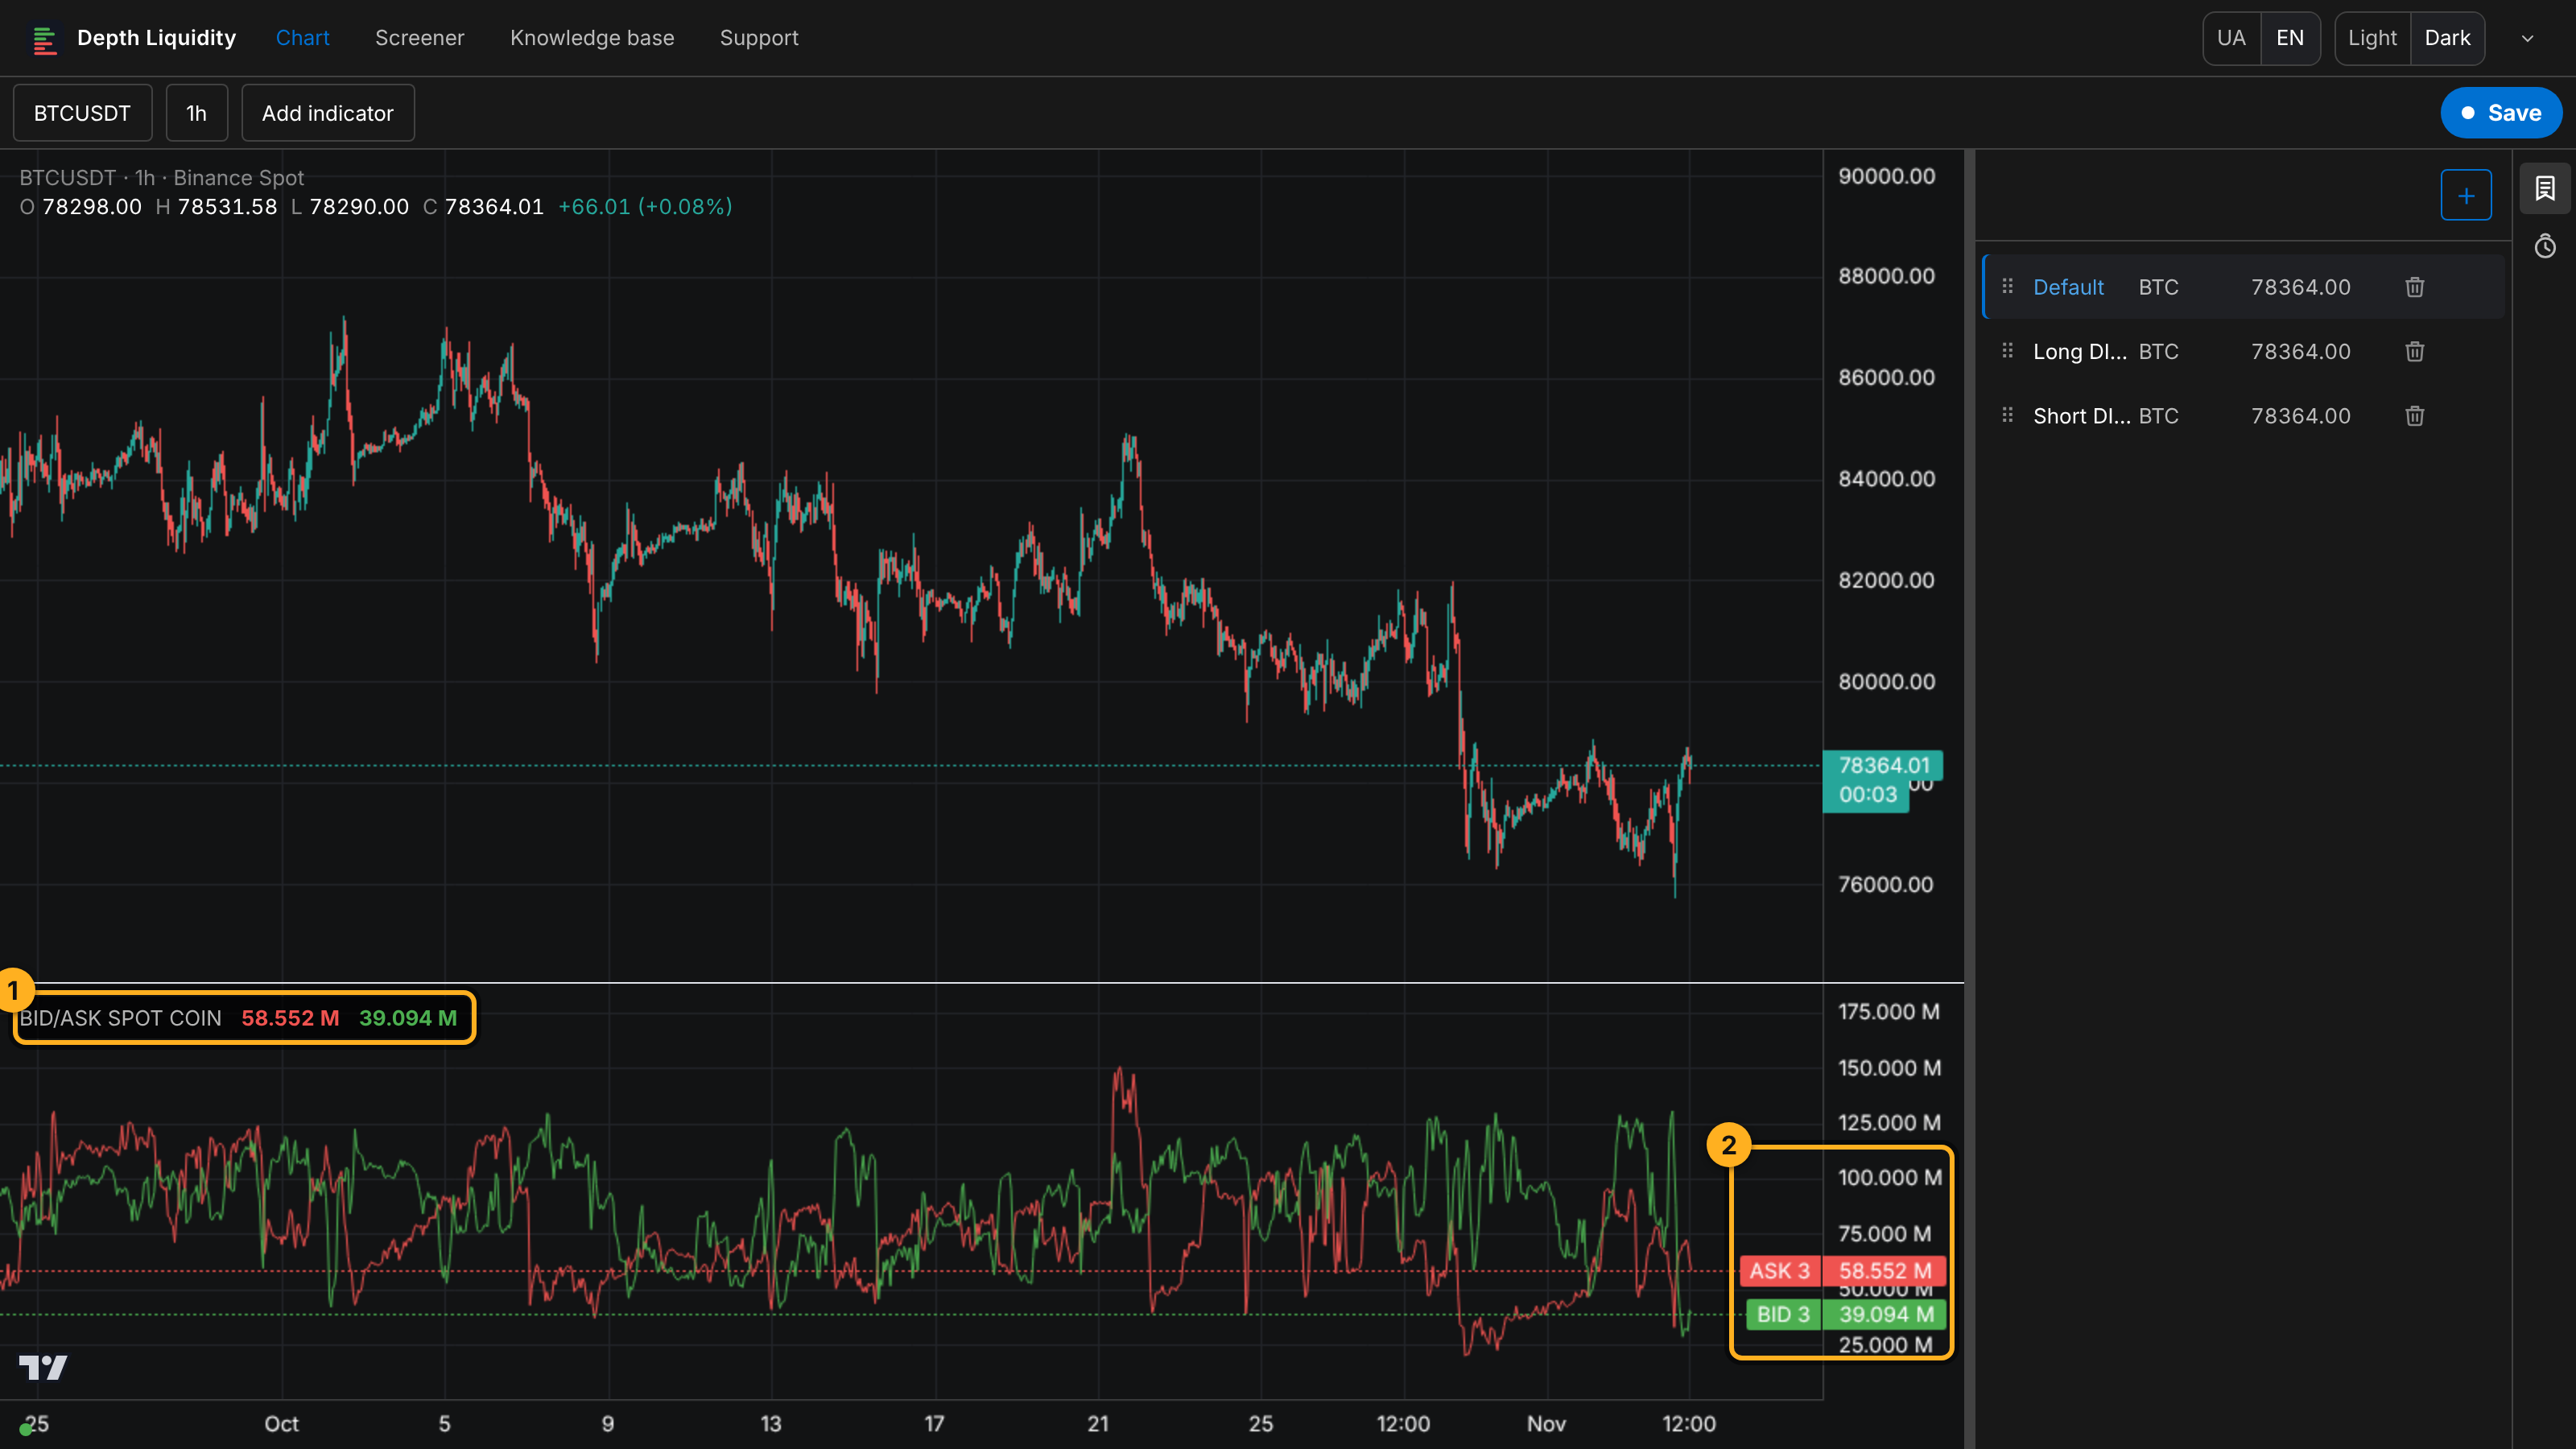
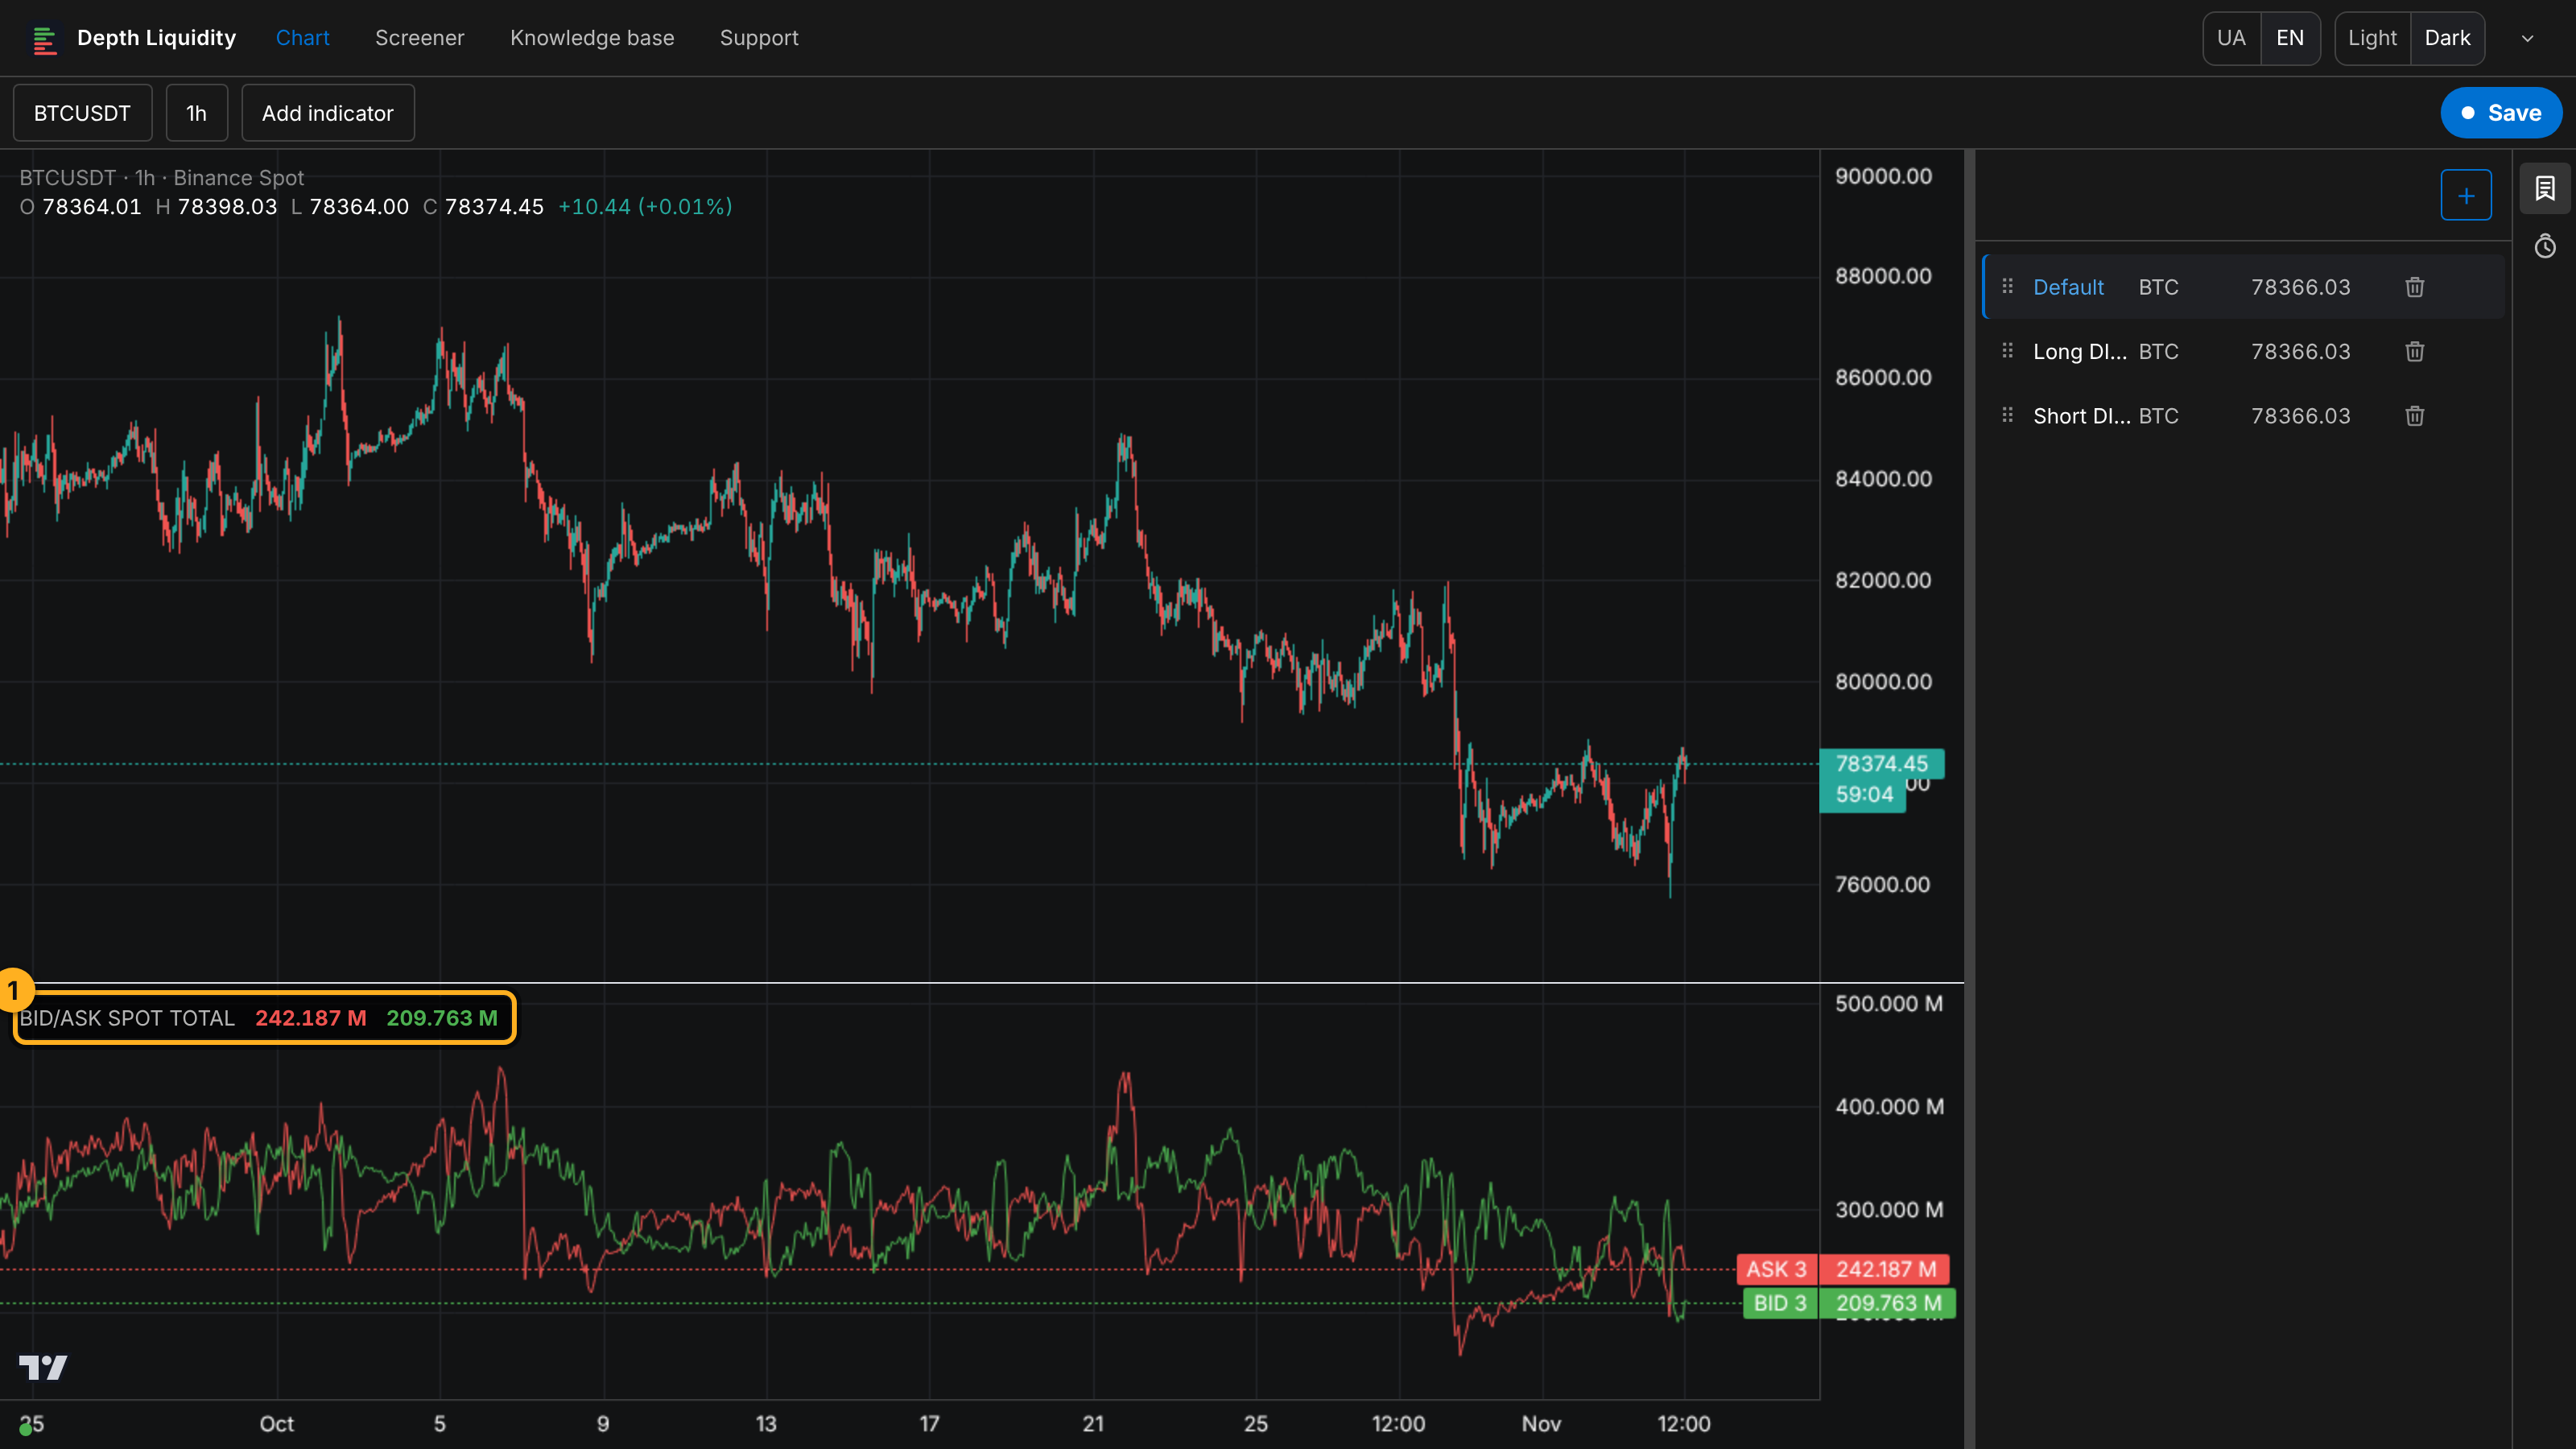
BID / ASK adds those orders up in dollars at each depth:
- BID 3: all limit buy orders within 3% below the price;
- ASK 3: all limit sell orders within 3% above the price.
Depths: 1.5%, 3%, 5%, 8%, 15%, 30%, 60%. The smaller the depth, the closer to the price and the faster the line moves. Values are in millions of dollars (M).
How to add it
- Open Chart and pick a coin, for example BTCUSDT.
- Click Add indicator (1) → BID/ASK (2).
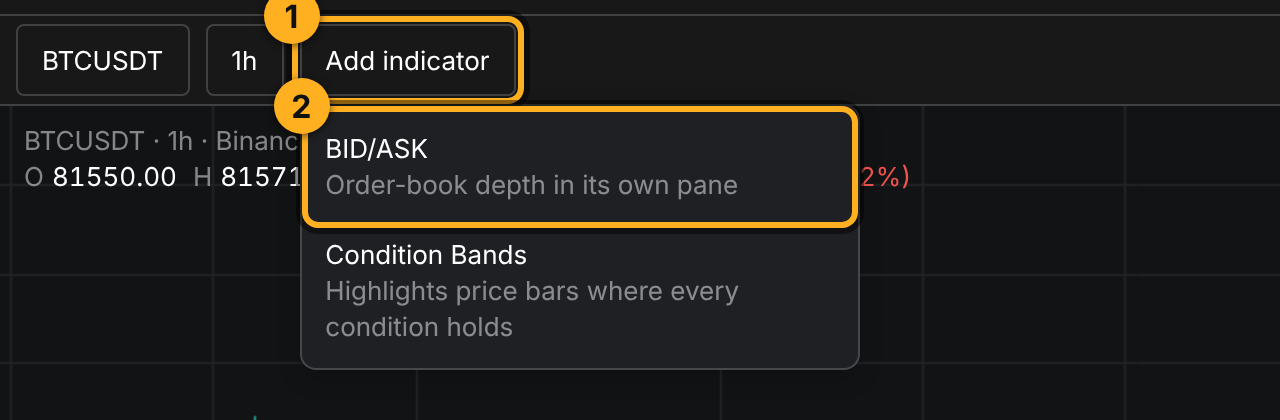
The Add indicator menu (1) with the BID/ASK item (2). - On the Arguments tab, open Coin type (1): COIN is this coin, TOTAL (2) is the whole market.
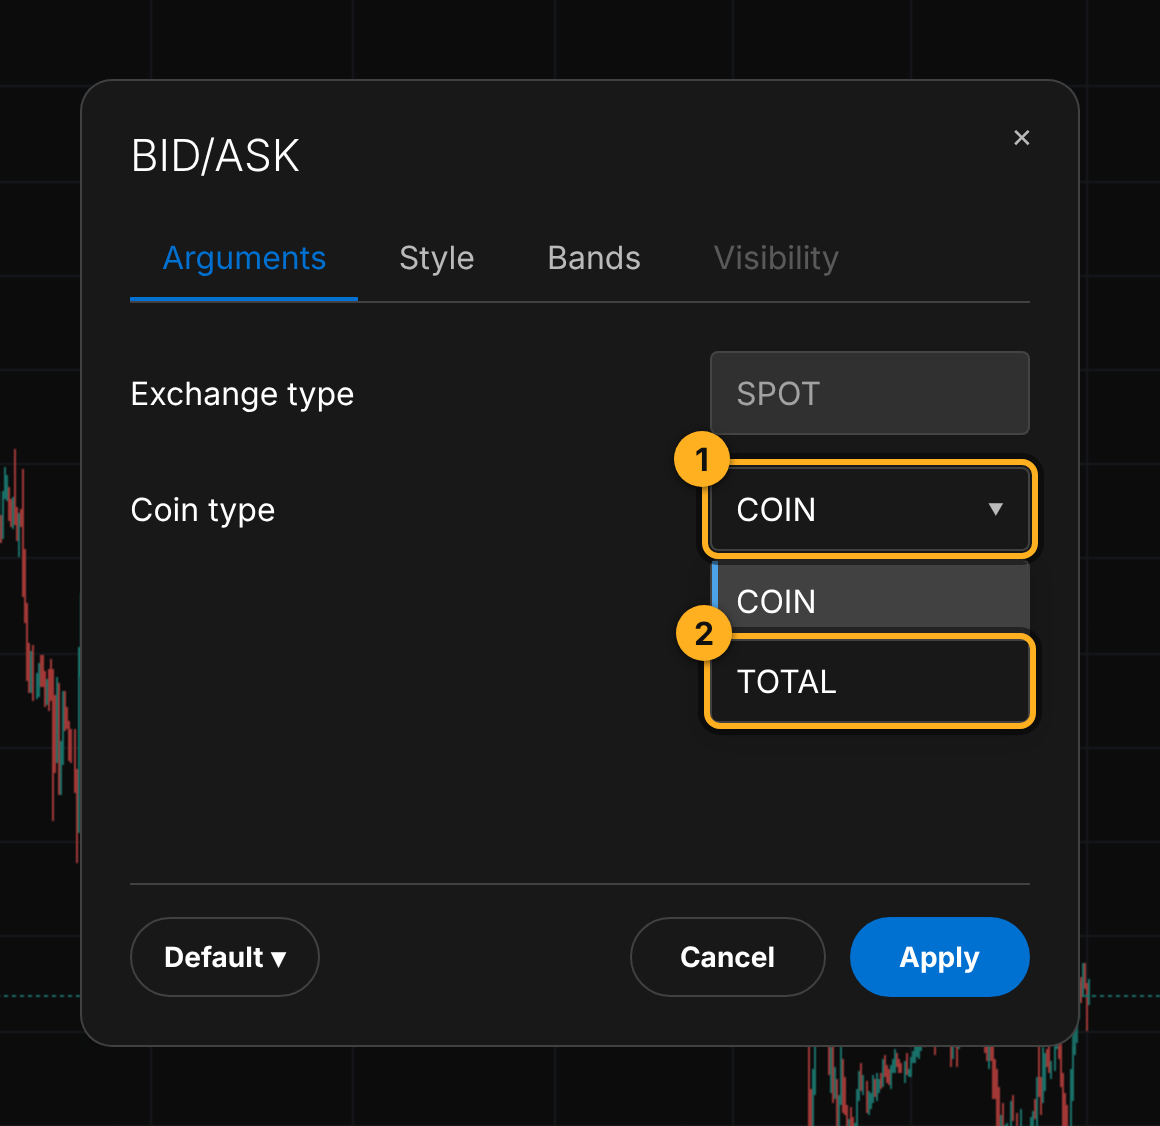
The Arguments tab: the Coin type list (1) and the TOTAL option (2). - On the Style tab, tick the depths you want to see. BID 3 and ASK 3 are on by default (1).
- Click Apply (4). The indicator shows up in its own pane under the price chart.
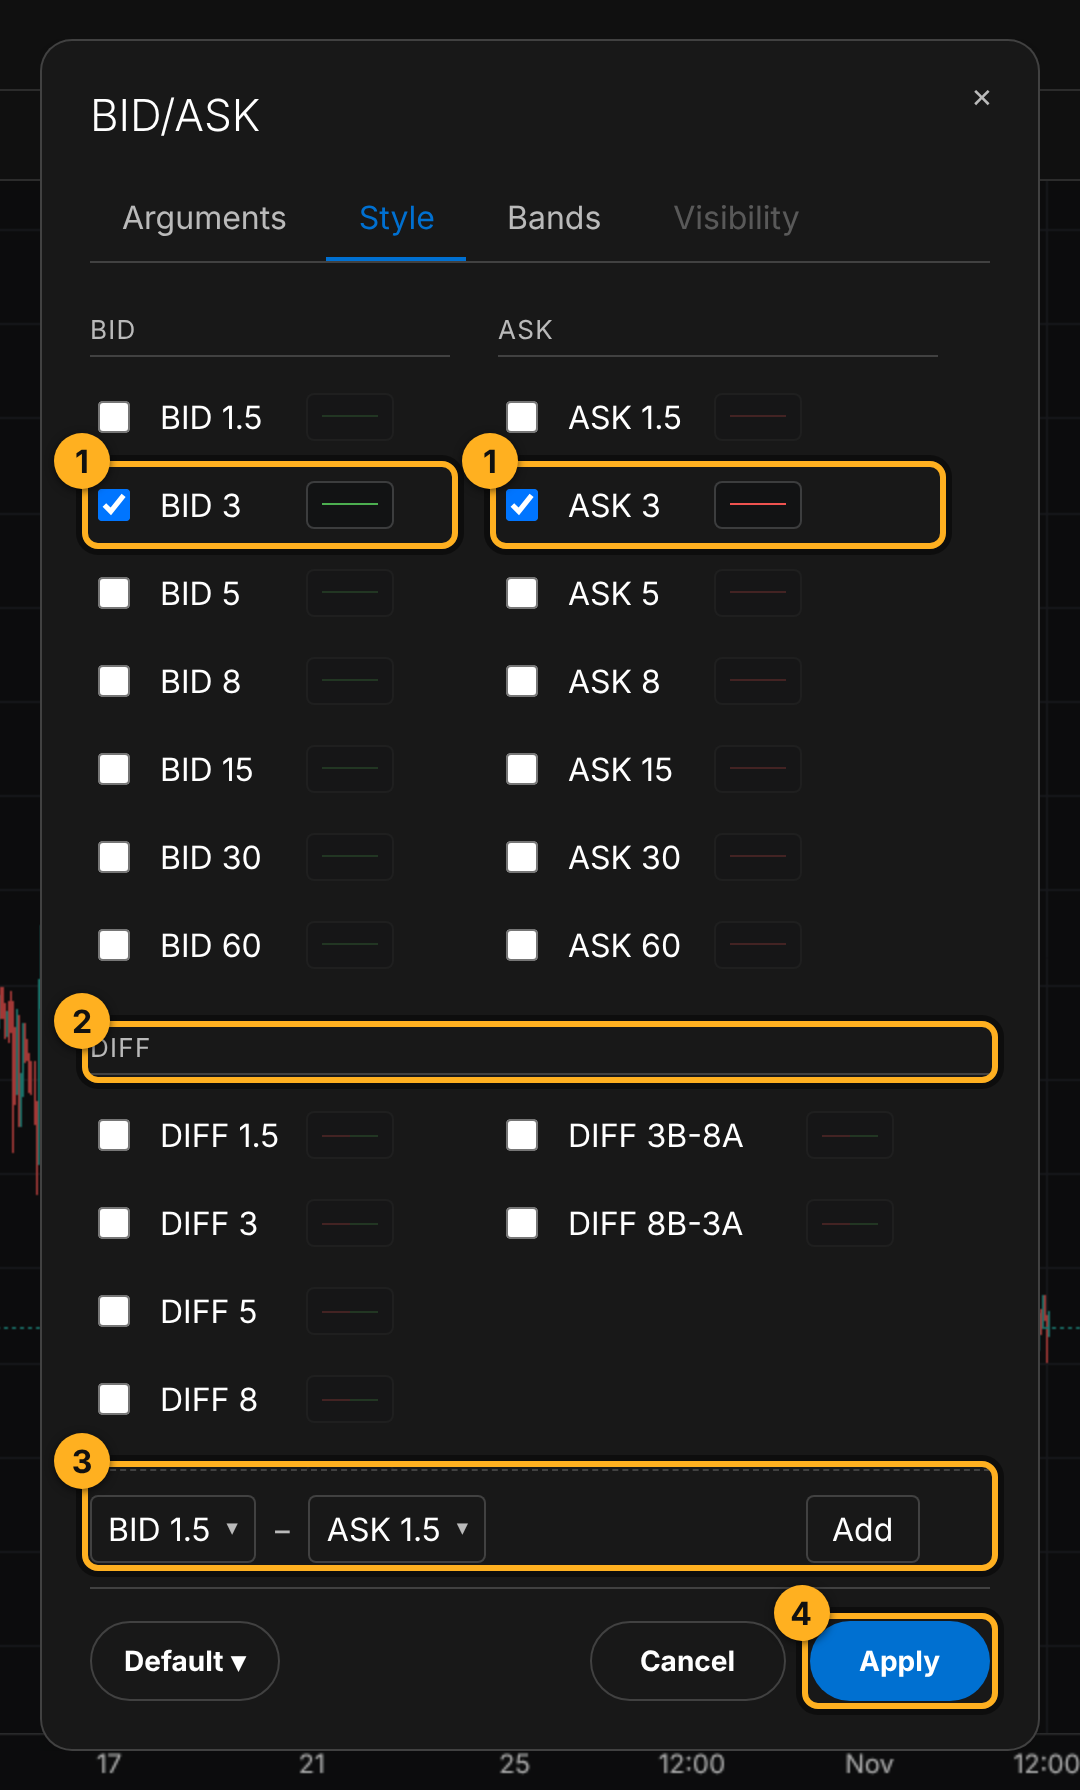
1 Lines that are on, and their colour (click the line sample to change it). 2 Ready-made DIFF lines (more on them below). 3 Build your own BID − ASK pair. 4 Apply.
You need an account: without signing in, the platform will offer to sign up.
Settings
| Setting | Where | Values | What it changes |
|---|---|---|---|
| Exchange type | Arguments | SPOT | Market: Binance spot |
| Coin type | Arguments | COIN / TOTAL | One coin or the whole market |
| BID / ASK | Style | 1.5 … 60 | Which depths to draw |
| DIFF | Style | 1.5 … 8, 3B-8A, 8B-3A | BID minus ASK |
| Custom DIFF | Style, bottom | e.g. BID 3 − ASK 5 → Add | Any pair of depths |
| Draw bands | Bands | on / off | Highlight candles where conditions hold |
| Conditions | Bands | line or number, > < >= <= = | When to highlight |
DIFF: BID minus ASK
DIFF is BID minus ASK as one line. DIFF 3 = BID 3 − ASK 3: above zero, buyers have more; below zero, sellers do. DIFF 3B-8A = BID 3 − ASK 8, comparing two different depths. You can build your own pair at the bottom of the Style tab (3 on the screenshot above).
Bands: highlight candles where a condition holds
The Bands tab shades the price chart background on every candle where your conditions hold. One look shows how often the condition happens and what price did next.
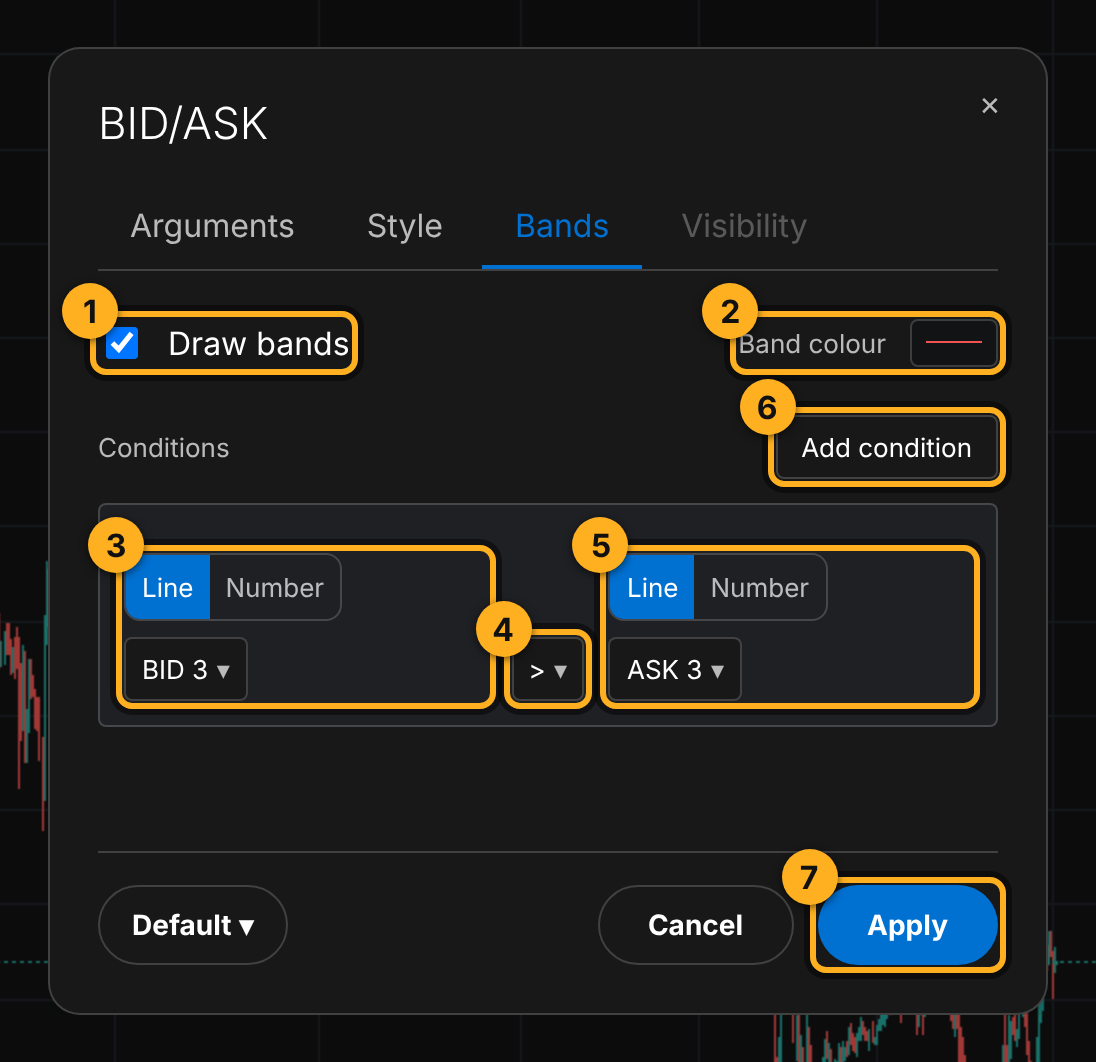
- Draw bands: turn the highlight on.
- Band colour: colour of the bands.
- Left side. Line is an indicator line (only lines turned on in the Style tab are listed), Number is a fixed value.
- Comparison:
><>=<==. - Right side: another line (Line) or a number (Number). Numbers are in full dollars: $300M =
300000000. - Add condition: add one more. Conditions are joined with AND, so a band appears only where all of them hold. Remove one with ×.
- Apply.
The screenshot uses BID 3 > ASK 3. The result:
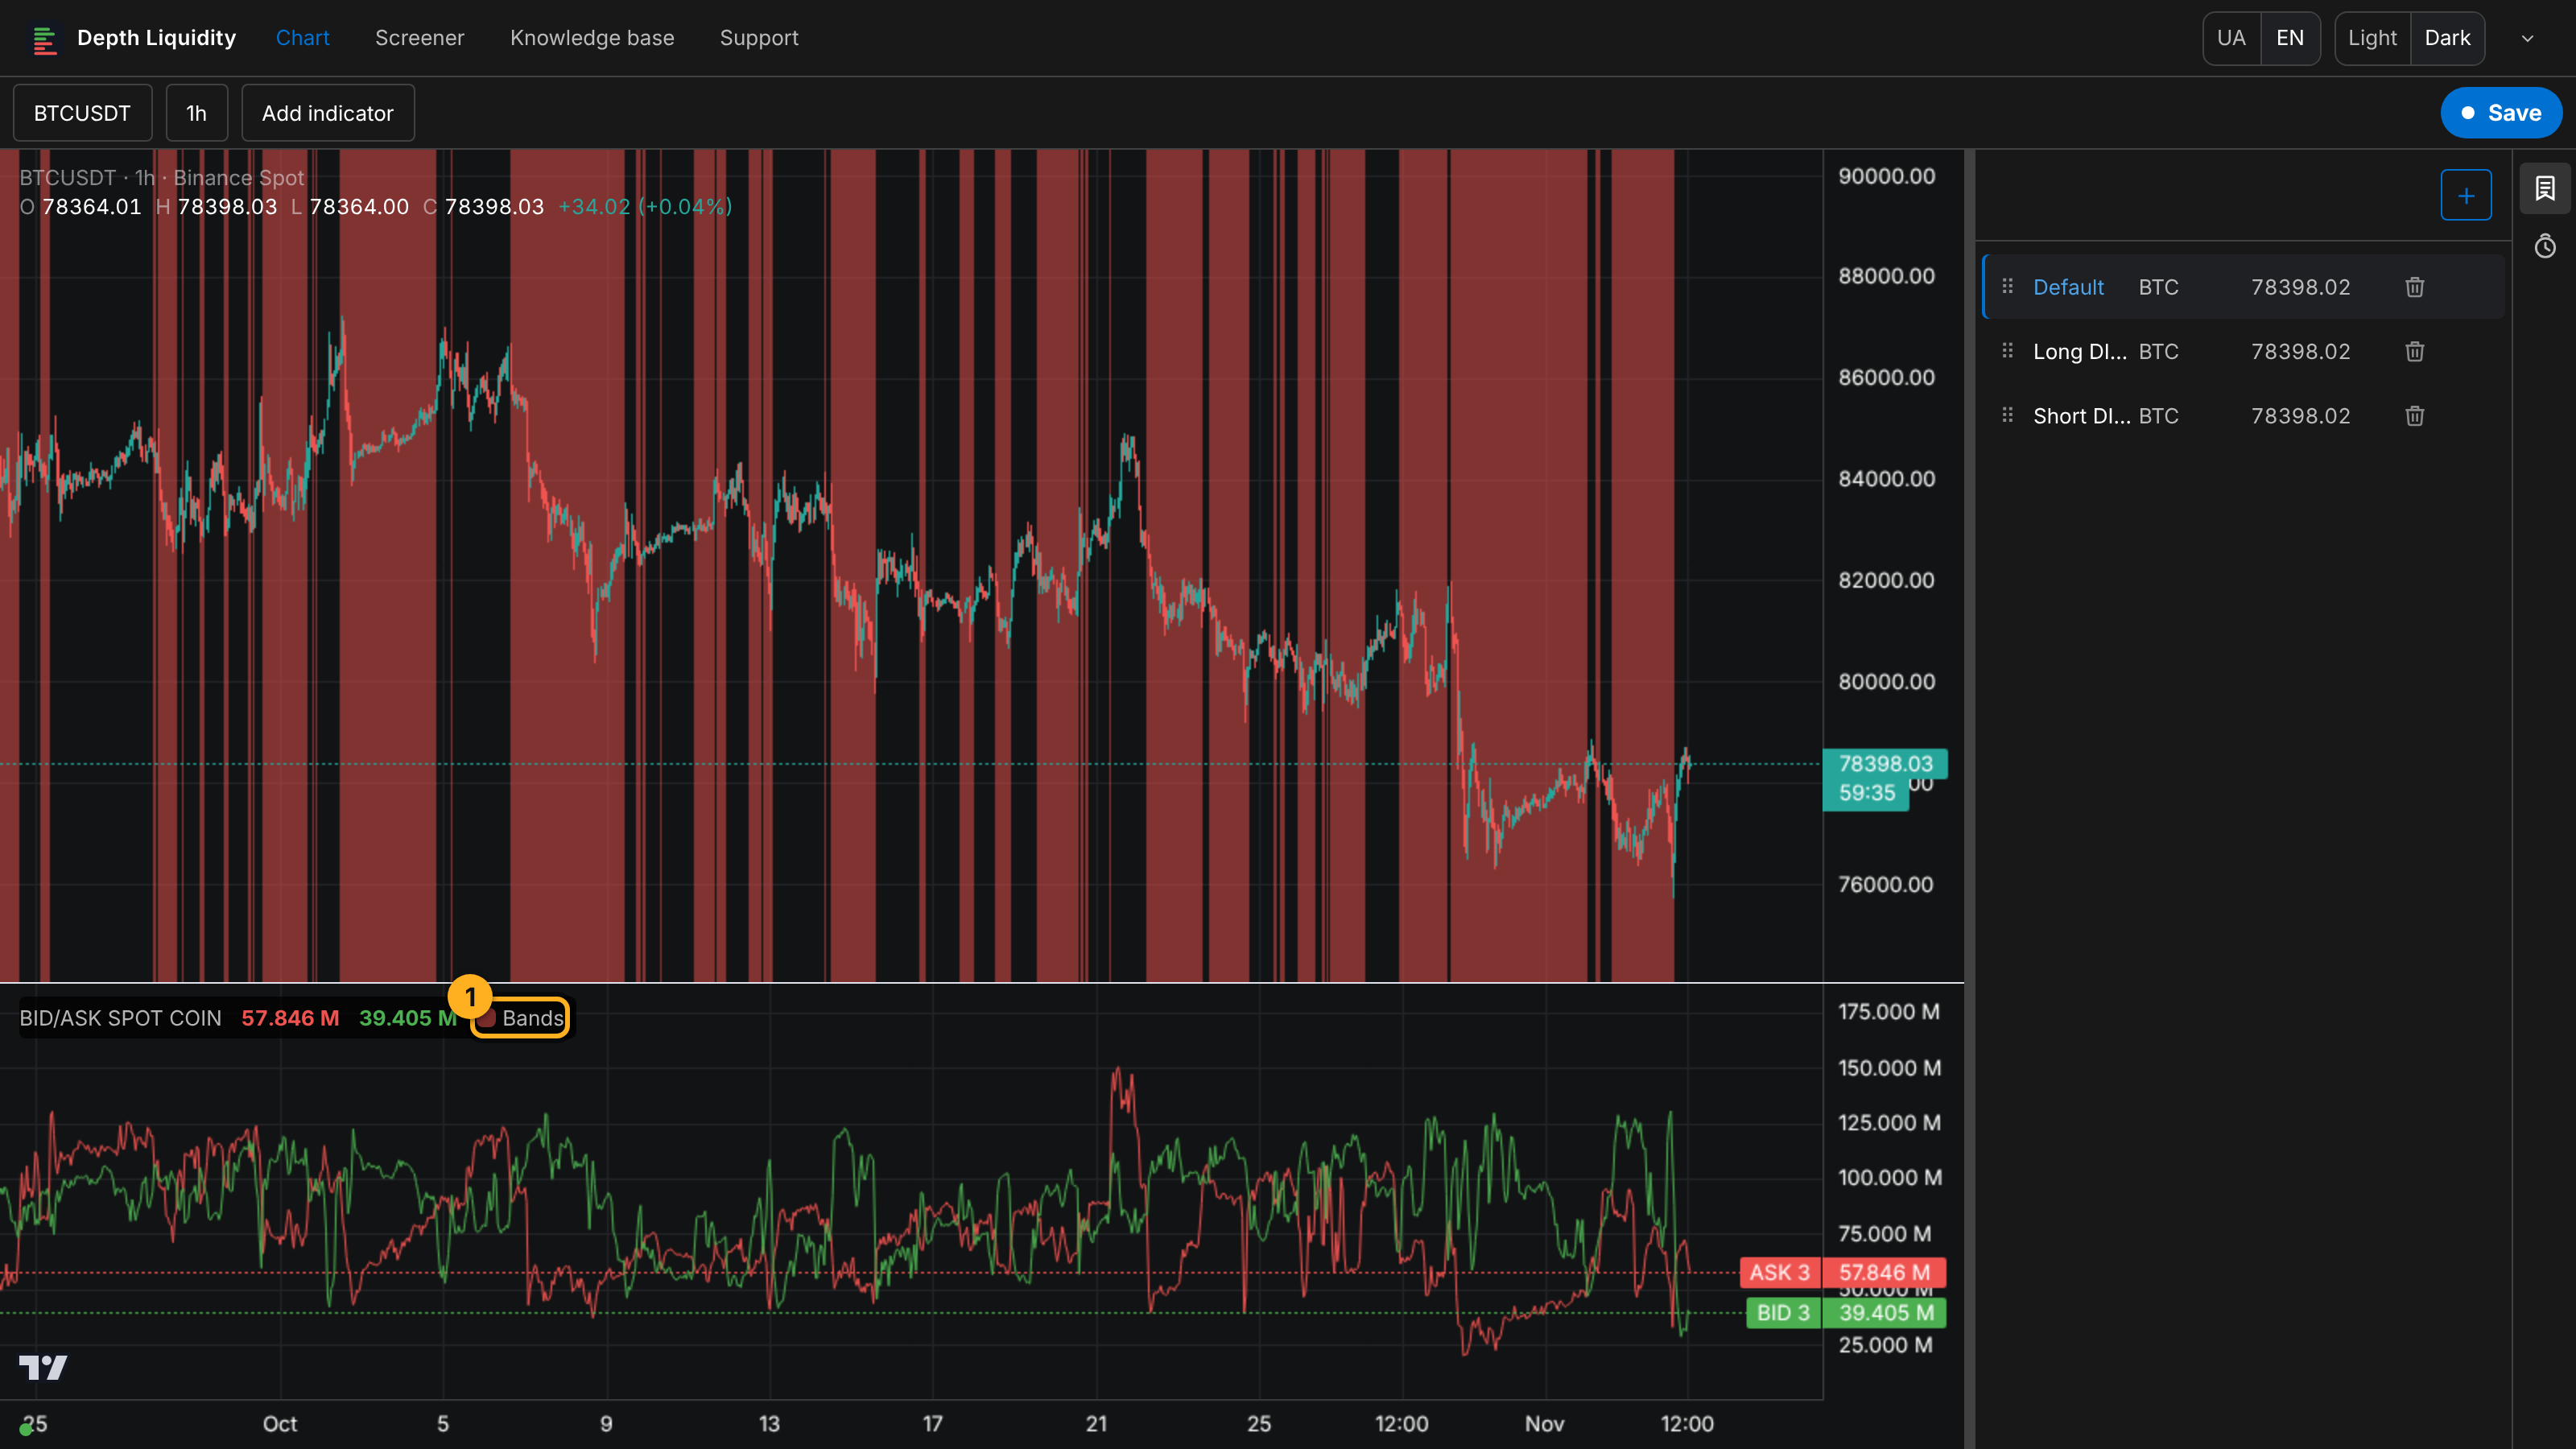
Bands inside BID/ASK work with the lines of that one indicator. To combine conditions from several panes, say a coin and TOTAL, use the separate Condition Bands indicator.
How to read it
BID above ASK: buyers are holding the price
There is more money bidding near the price than offering. A seller has to eat through more orders to push price down.
ASK above BID: sellers are capping the move up
More money is waiting to sell above the price. To go higher, buyers have to absorb it.
Lines close together: no clear edge
If BID and ASK are about equal, the book doesn't favour either side. Better to wait until one line clearly pulls away.
Price and book disagree
Price falls while ASK stays high: the seller keeps restacking orders lower and pushing. Price rises even as ASK grows: the market is absorbing the selling, which can mean a phase change.
Common mistakes
- Comparing dollars across coins. $50M is small for BTC and a huge wall for a small coin. Compare a coin's BID with its own ASK, not with other coins.
- Fixed dollar thresholds. Book volumes change with the market: a number that was a signal a few months ago may never show up today. Watch the balance between BID and ASK (in Bands, use Line, not Number).
- One candle is not a trend. The book changes every minute. Check that the edge holds for several candles.
Try it yourself
- Open BTCUSDT, timeframe 1h, add BID/ASK with BID 3 and ASK 3.
- On the Bands tab, turn on Draw bands and set BID 3 > ASK 3.
- Look at the last week: what did price do after long bands, and after short ones?
- Do the same on TOTAL. Do the bands match BTC?
Not financial advice.