Condition Bands: highlight candles where the coin and the market agree
What it shows
Each condition compares order book data: BID or ASK at a given depth, the BID − ASK difference, or a number. The indicator checks every condition on every candle and shades the ones where all of them hold. Up to 5 conditions.
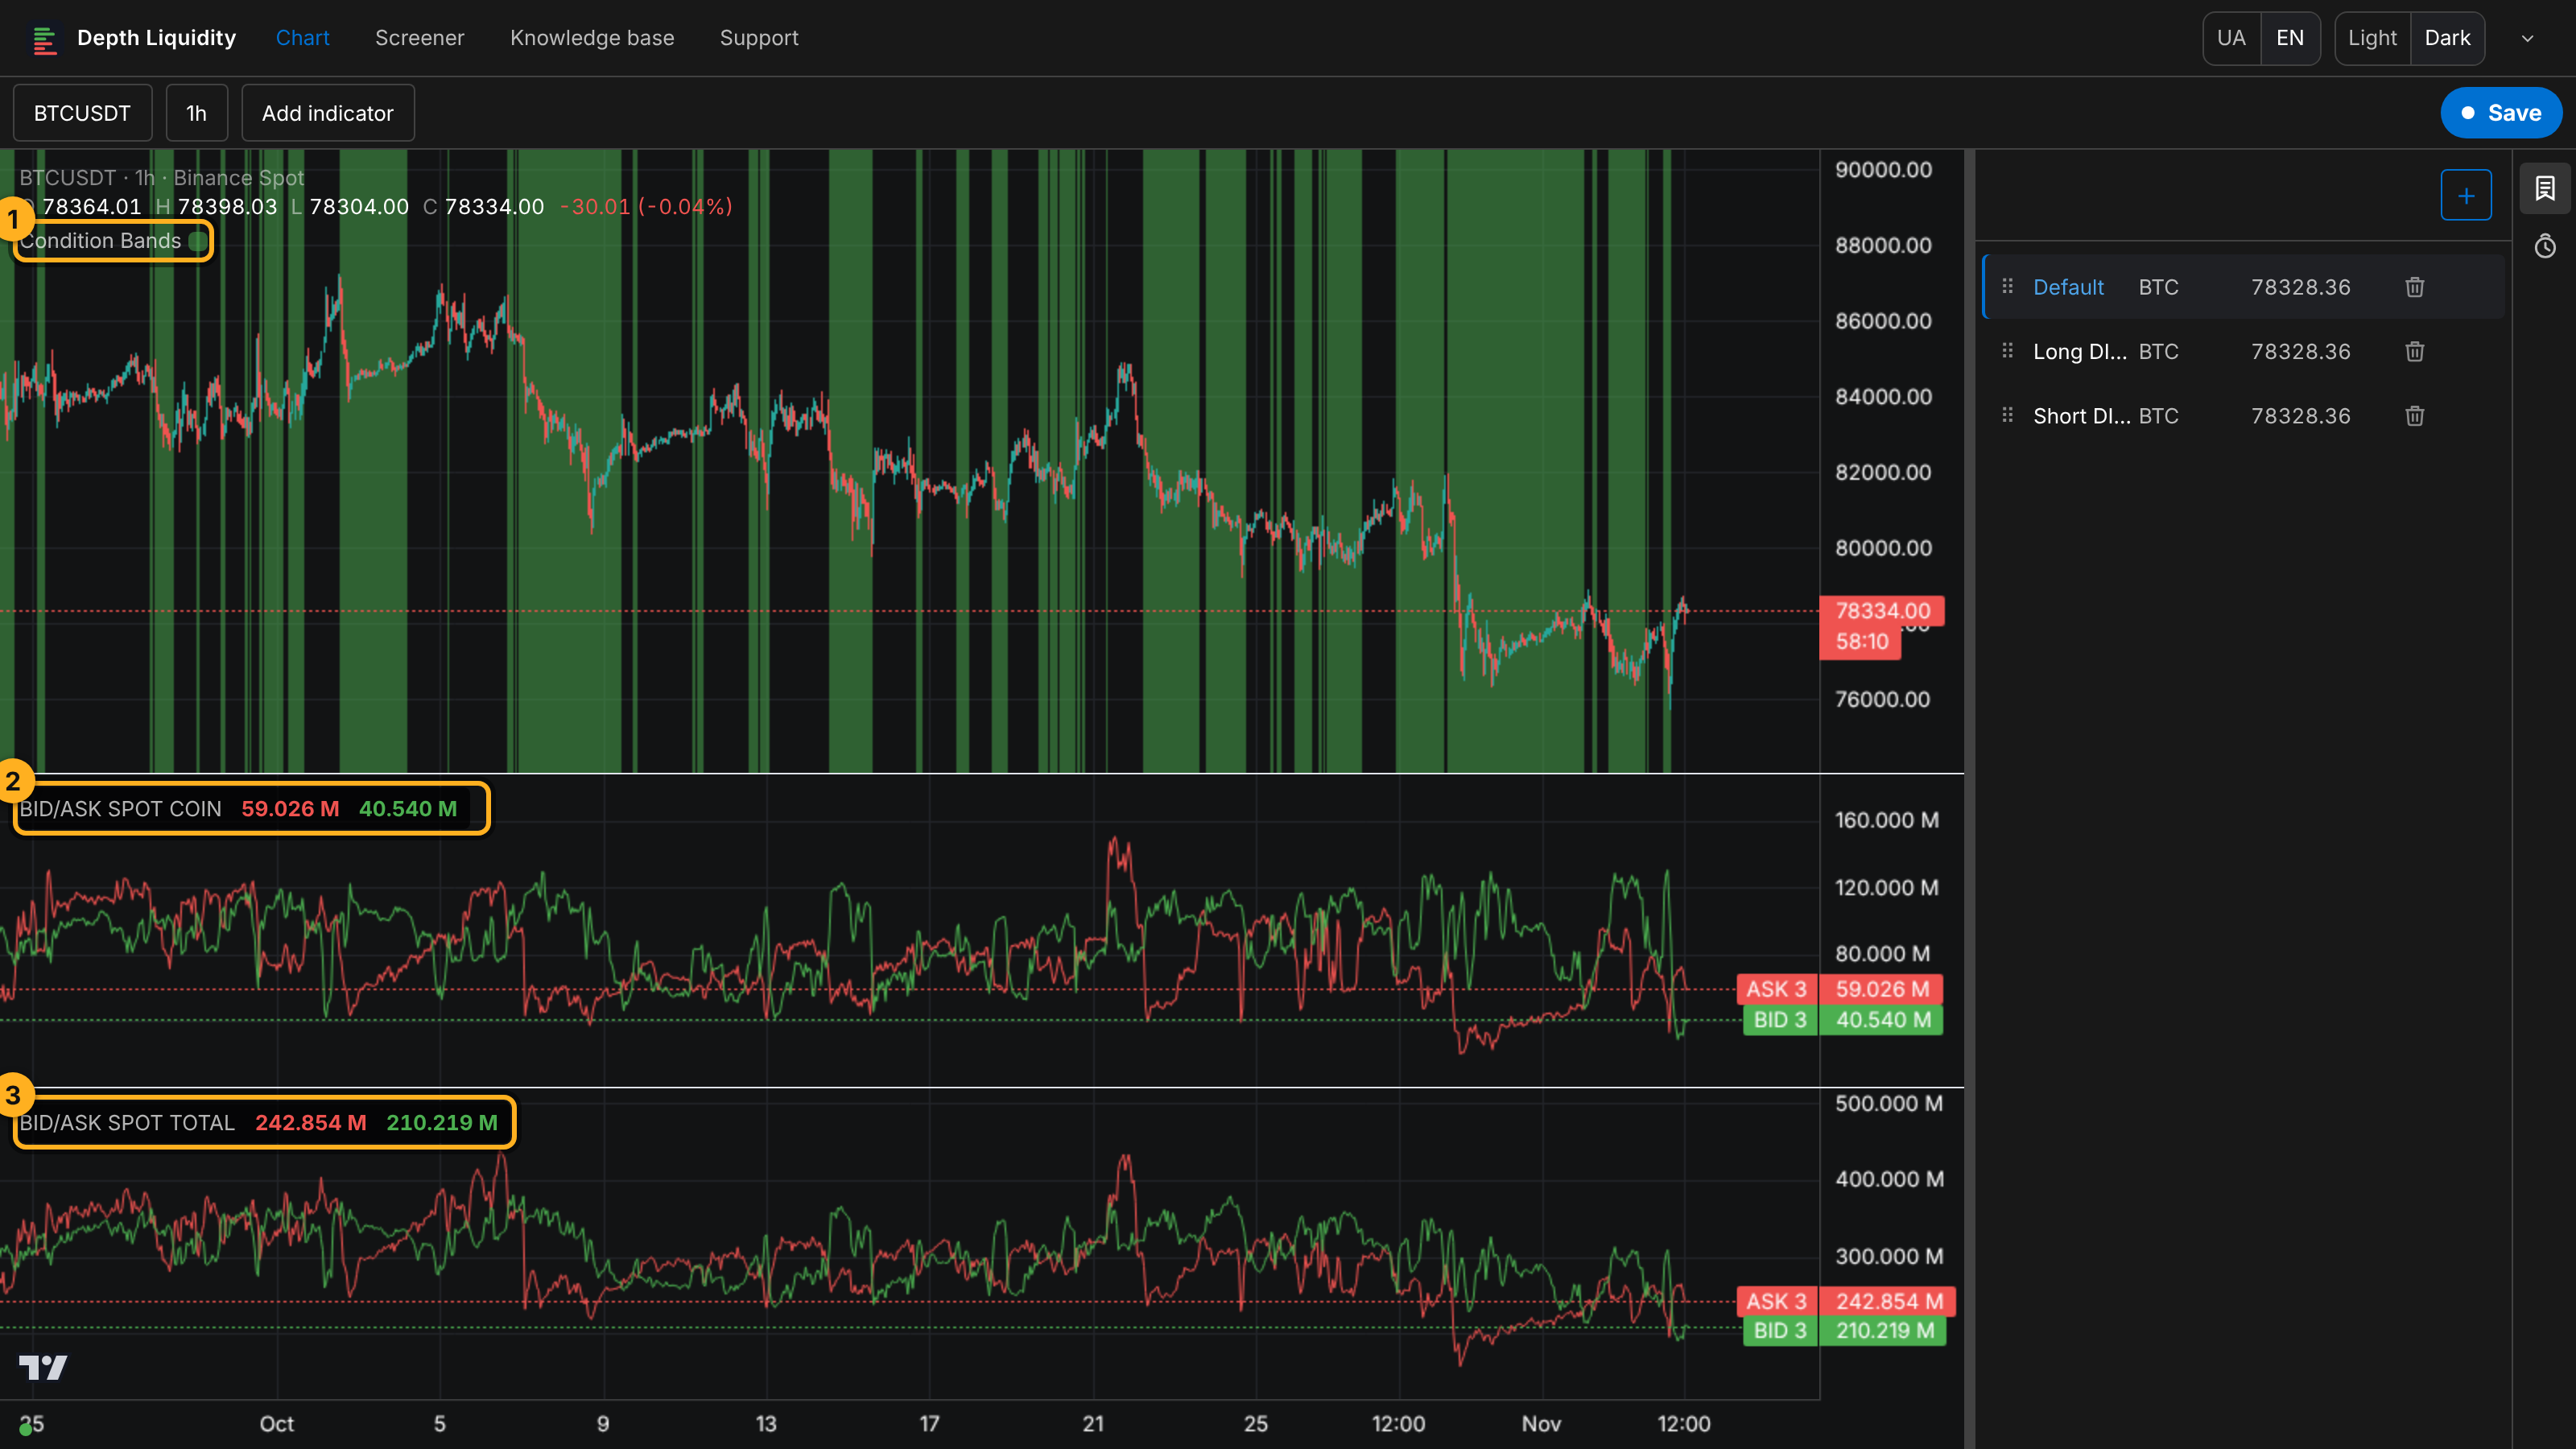
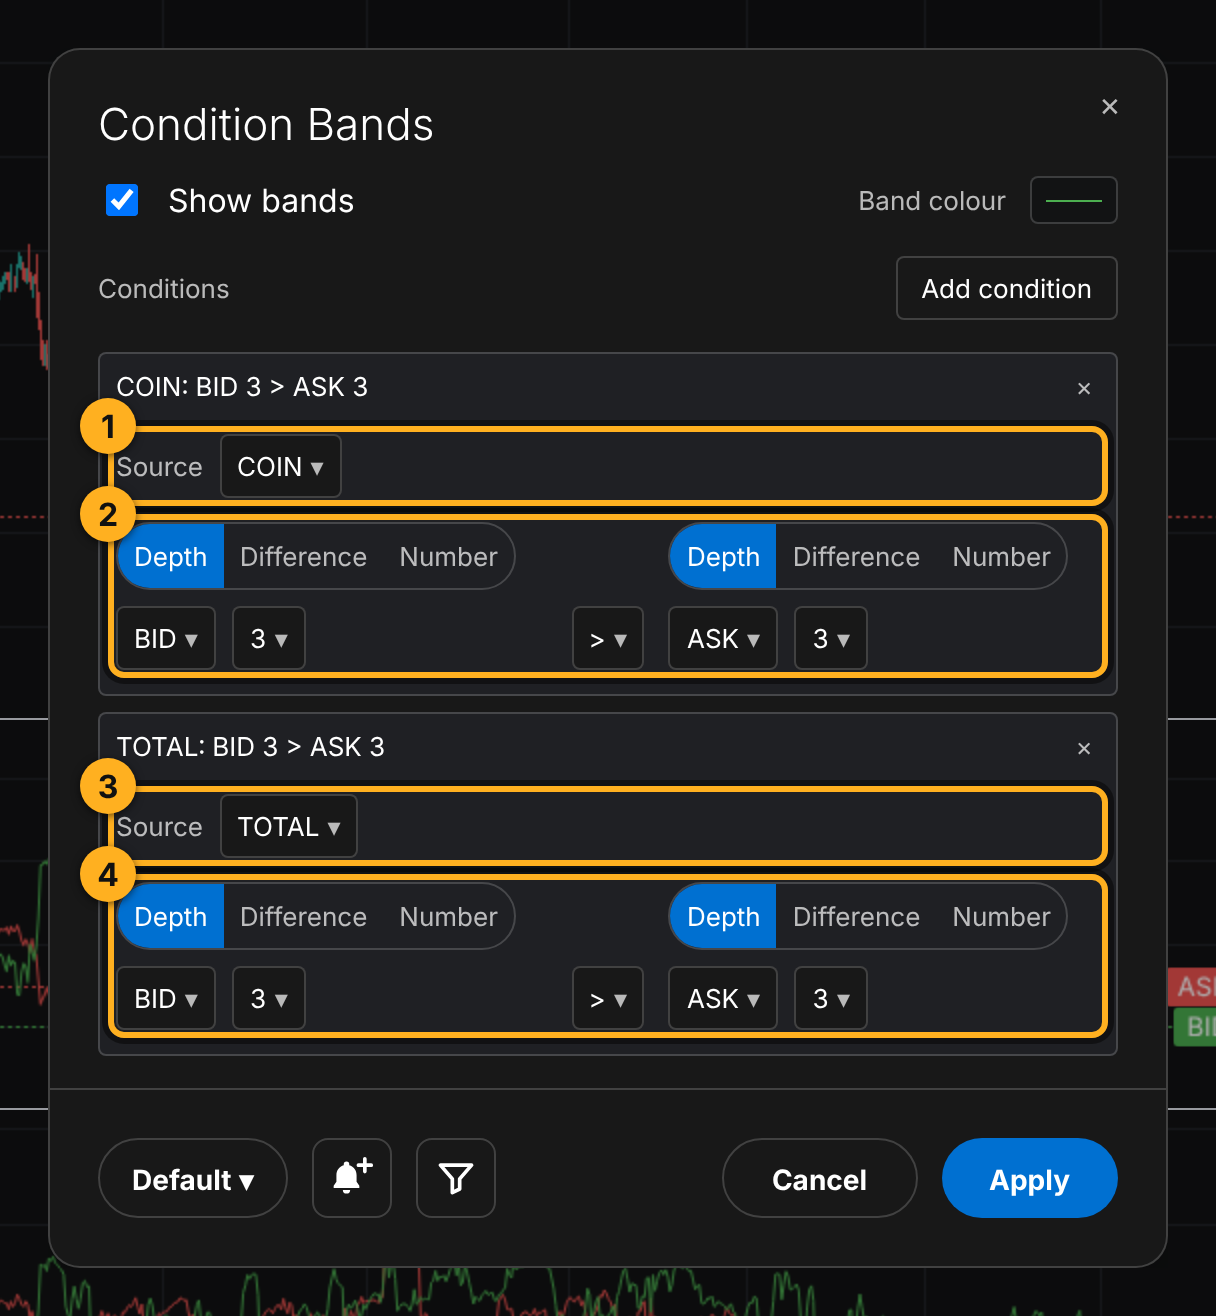
The Condition Bands settings behind this chart:
How it differs from Bands in BID / ASK
| Bands in BID / ASK | Condition Bands | |
|---|---|---|
| Data source | only that indicator's lines | each condition: COIN or TOTAL |
| Coin and market together | no | yes |
| Number of conditions | several, joined with AND | up to 5, joined with AND |
| BID − ASK in a condition | only if a DIFF line is on | Difference type right in the condition |
| Send to Screener / alert | no | yes, buttons at the bottom of the window |
For a simple case on one pane, Bands in BID / ASK is enough. For the coin and the market together, or when you want to search with the Screener and get alerts on the same rule, use Condition Bands.
How to add it
- On Chart, click Add indicator (1) → Condition Bands (2).
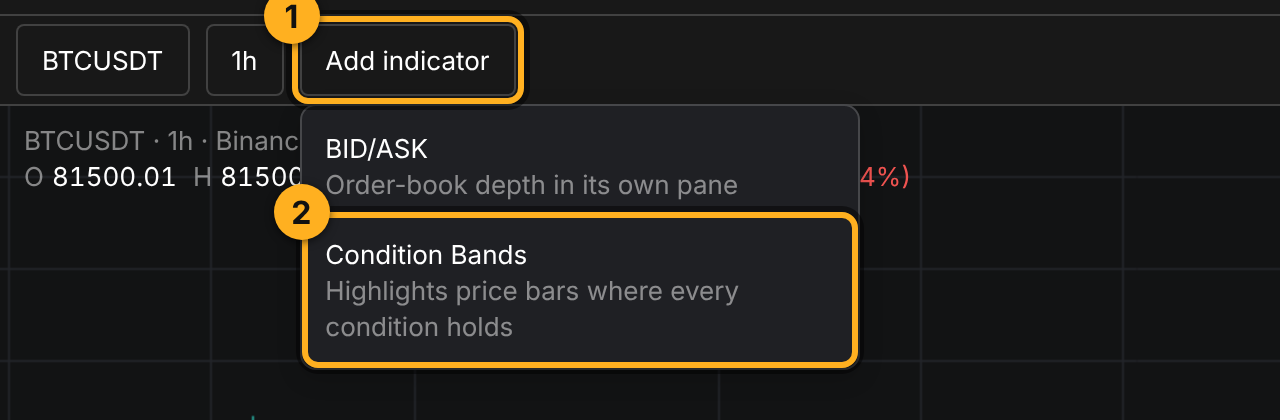
The Add indicator button (1) and the Condition Bands item (2). - A window opens with one condition. Here is what's in it:
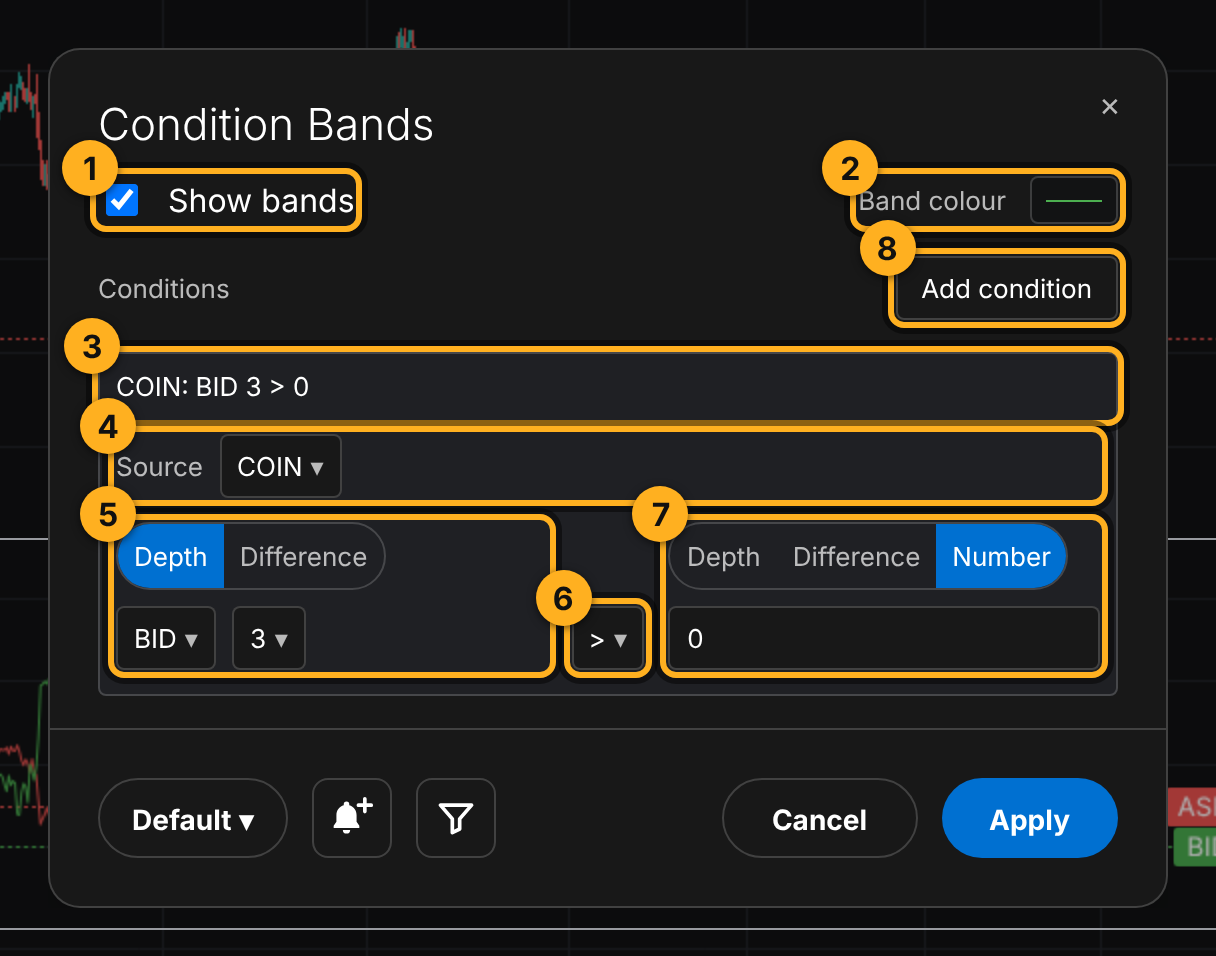
The Condition Bands window with one condition. Marks 1–8 are explained below. - Show bands: show the bands on the chart.
- Band colour.
- Condition summary as one line, for example
COIN: BID 3 > 0. Click it to collapse or expand the editor. - Source: COIN (the coin on the chart) or TOTAL (the whole Binance spot market).
- Left side. Depth is one side at one depth (BID or ASK, 1.5 … 60%). Difference is BID − ASK (see below).
- Comparison:
><>=<==. - Right side: Depth, Difference or Number. Numbers are in full dollars: $300M =
300000000. - Add condition: one more. Up to 5.
- Click Apply.
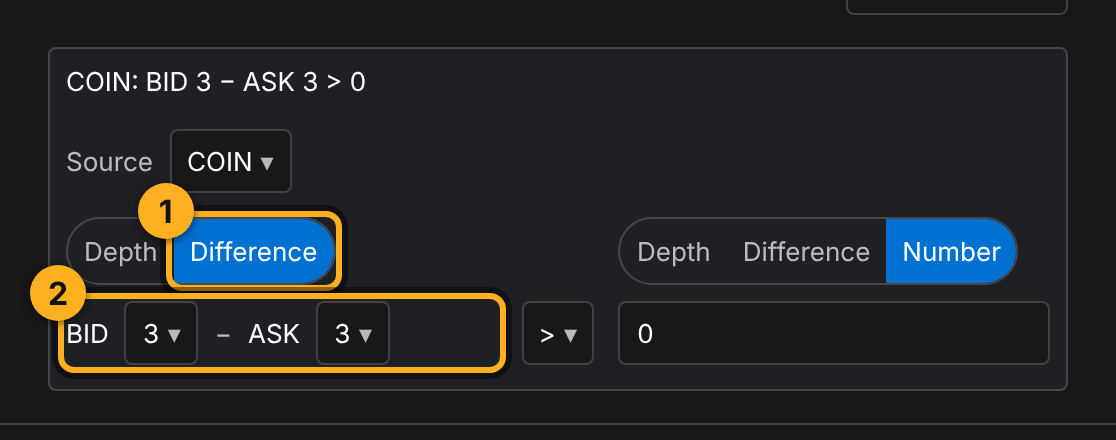
Difference: BID minus ASK in one condition
Difference computes the difference of BID and ASK at any depths, say BID 3 − ASK 1.5, right inside the condition, no separate DIFF line needed. BID 3 − ASK 3 > 0 means the same as BID 3 > ASK 3.
Example: the coin and the market leaning the same way
The rule: BTC has more buyers than sellers near the price, and so does the whole market.
- Condition 1: Source = COIN, left Depth BID 3,
>, right Depth ASK 3. - Add condition. Condition 2: Source = TOTAL, BID 3
>ASK 3. - Collapse the conditions by clicking their summaries to see both at once.
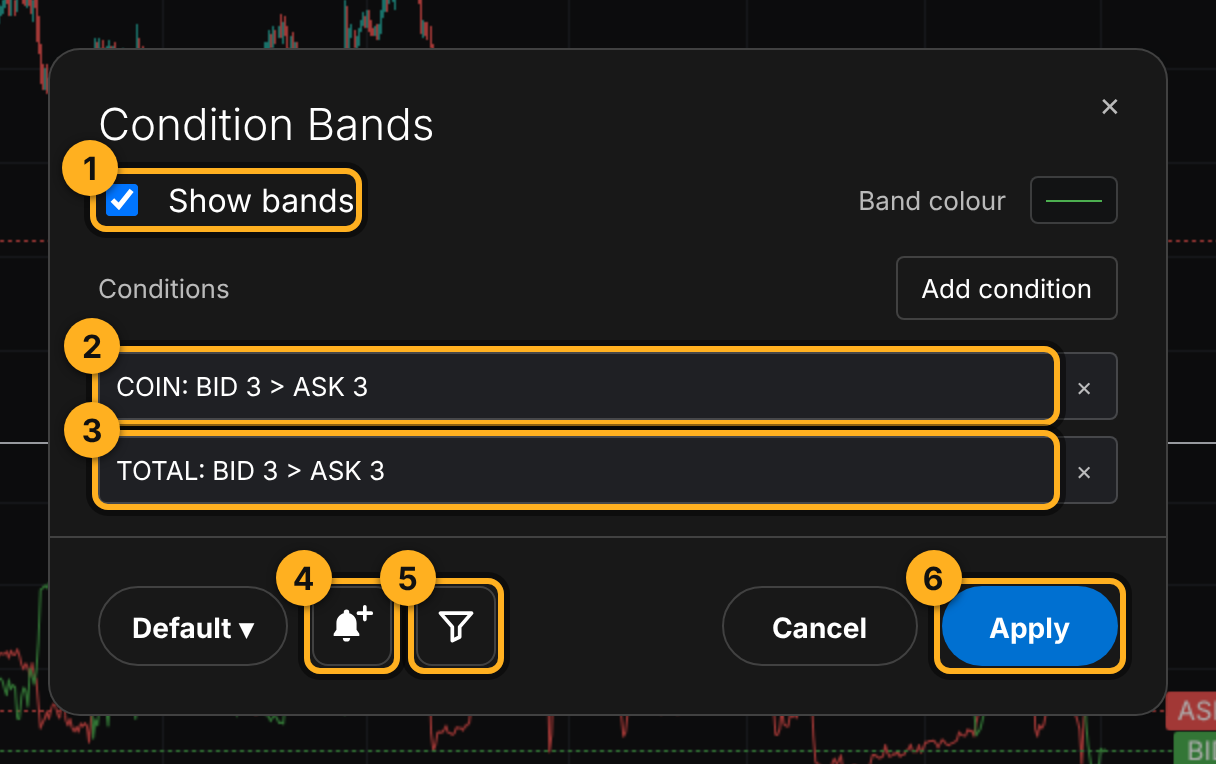
The result is the first screenshot in this article: bands only where both conditions held together.
How to read it
A long band: the edge holds
Several candles in a row under a band mean the condition is not a fluke: buyers keep the edge in both the coin and the market.
Scattered thin lines: noise
Single candles spread across the chart mean the condition flips on and off. Add a condition or use a deeper depth (5, 8).
Bands that disappear once TOTAL is added
Compare the chart with only the COIN condition and with both. Bands that vanish after adding TOTAL are moments when buyers held the coin while the market leaned to sellers. Those moments are worth a closer look.
Common mistakes
- Too many conditions. The more conditions, the rarer they all hold together. Start with two, add one at a time, and watch how many bands remain.
- Fixed dollar numbers. Book volumes change with the market. For comparisons, prefer Depth vs Depth or Difference vs 0 over Number.
- Reading a band as an entry signal. A band shows the book was on the buyers' side. What price does next is a separate question; look at what happened after similar bands in the past.
Try it yourself
- Open BTCUSDT, 1h, add Condition Bands with
COIN: BID 3 > ASK 3. Count the bands over a week. - Add a second condition,
TOTAL: BID 3 > ASK 3. How many bands are left? - Click Use in screener: which coins pass the same conditions right now?
Not financial advice.