BTC mining cost: what it costs to mine one bitcoin
What it shows
The cost depends on three things:
- network difficulty: the higher it is, the more computation one block takes;
- ASIC efficiency: how many watts it burns per terahash;
- electricity price in dollars per kilowatt-hour.
The indicator takes network difficulty from blockchain data, and the ASICs and electricity price from the settings. The lines sit on the same scale as price. The difficulty the network projects for the next adjustment is drawn dashed to the right of the last candle.
Only electricity is counted. Transaction fees, hardware, rent and salaries are not, so a miner's real cost is higher.
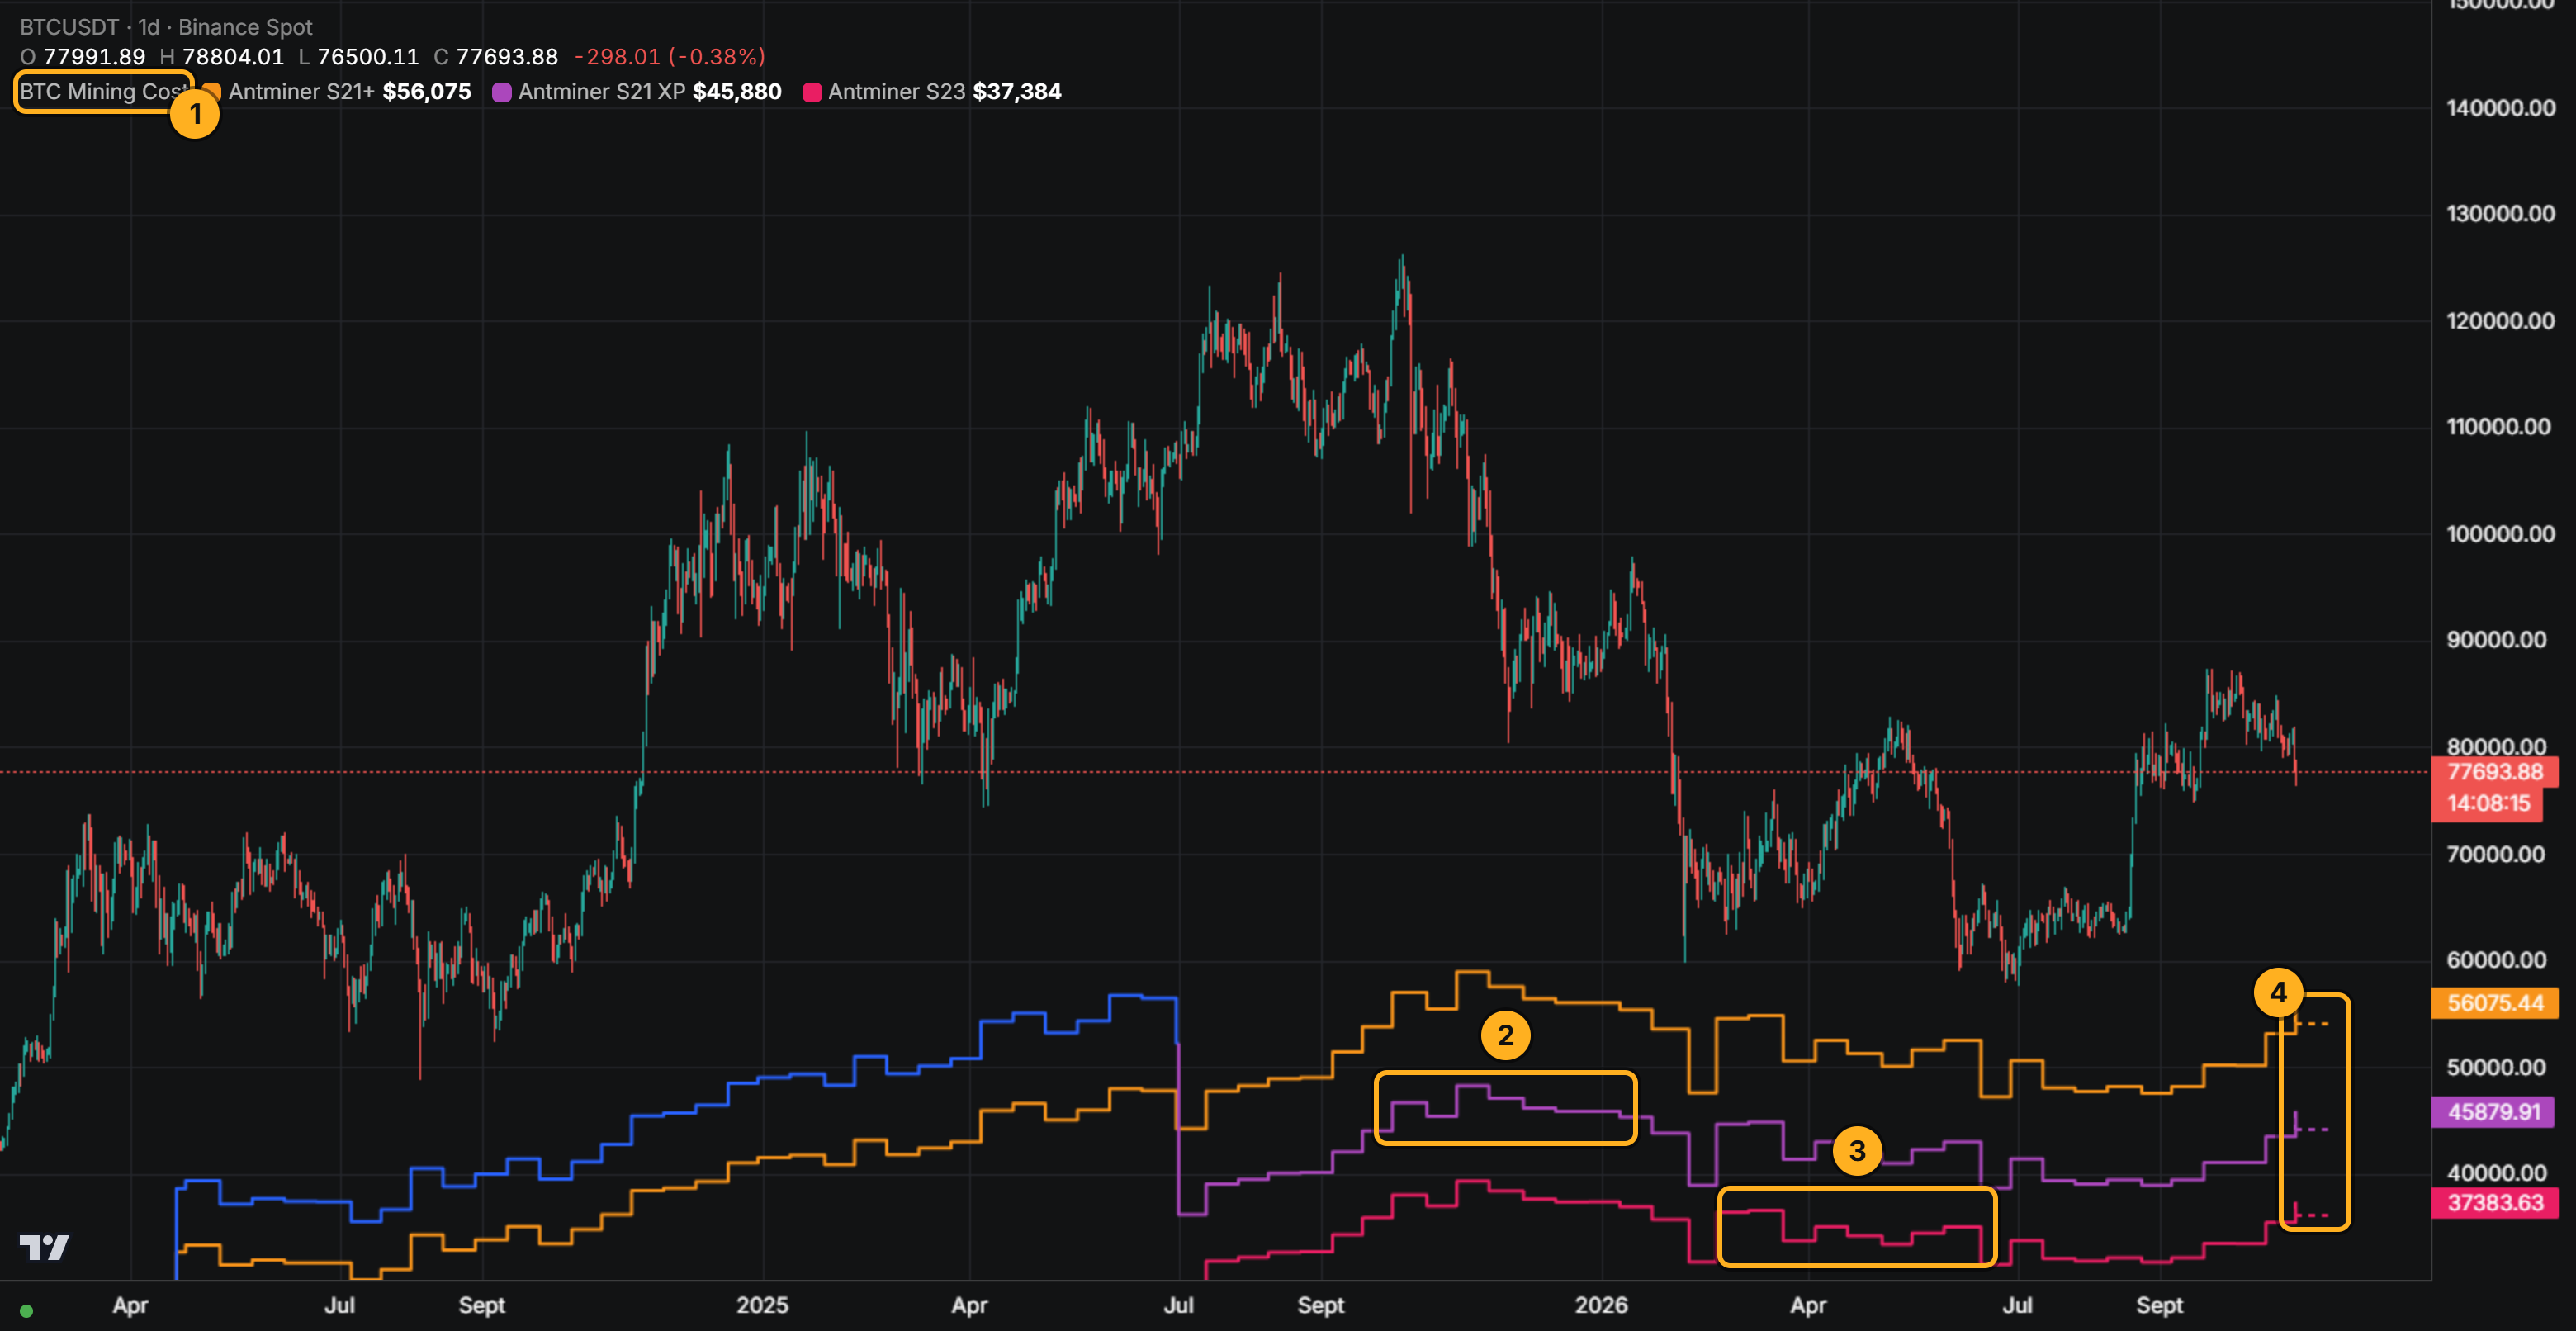
How to add it
- Open Chart with BTCUSDT. The indicator works for bitcoin only.
- Click Add indicator → BTC Mining Cost.
- Click Apply. The lines appear right on the price chart.
For long history, the 1d timeframe works best: it shows several halving cycles at once.
Settings: periods and ASICs
The settings are split into periods, on the Groups tab. Click a period to expand it. Each period has:
- Period, UTC: a start and end date (leave the end empty and the period runs to today);
- Electricity, $/kWh: the electricity price;
- up to three ASICs, each with a name (Name), hashrate (Hashrate, TH/s), power draw (Power, W) and a line colour.
The first ASIC in every period draws line 1, the second line 2, the third line 3. + Add ASIC adds an ASIC, + Add group adds a period.
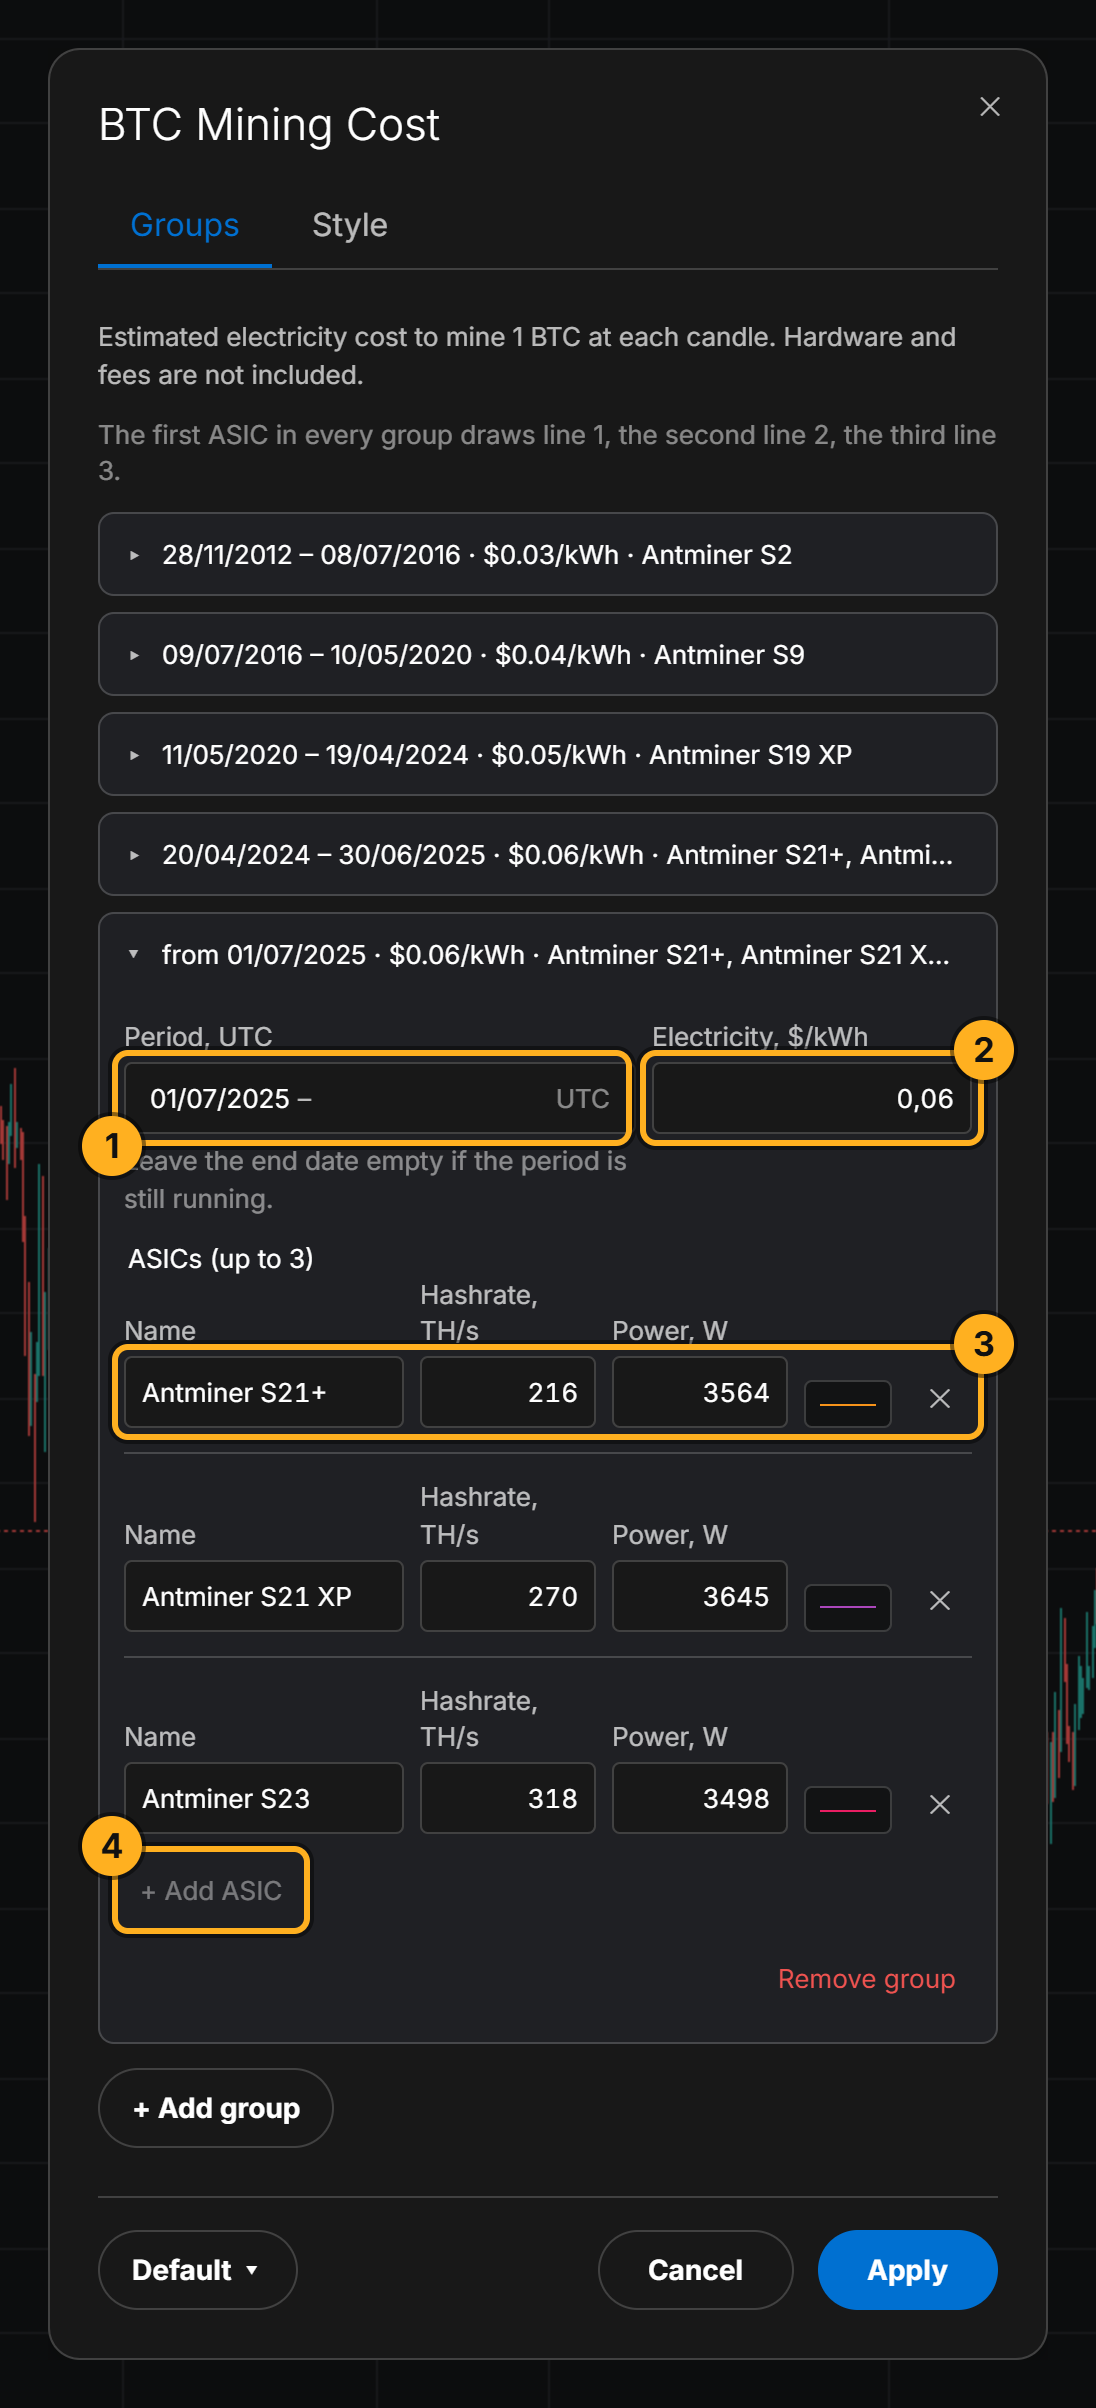
By default the periods follow halving cycles:
| Period | Electricity | ASIC |
|---|---|---|
| 2012-11-28 … 2016-07-08 | $0.03 | Antminer S2 |
| 2016-07-09 … 2020-05-10 | $0.04 | Antminer S9 |
| 2020-05-11 … 2024-04-19 | $0.05 | Antminer S19 XP |
| 2024-04-20 … 2025-06-30 | $0.06 | Antminer S21+, Antminer T21 |
| from 2025-07-01 | $0.06 | Antminer S21+, Antminer S21 XP, Antminer S23 |
Change the electricity price or add your own ASIC and the lines recalculate. Your changes are saved in the chart preset.
How it is calculated
Energy per block equals the number of hashes times the ASIC's efficiency. The number of hashes per block comes from network difficulty. Divide by the block reward, which halves at every halving, and you get the electricity cost of 1 BTC:
cost = difficulty × 2³² × (W / TH) × ($/kWh) ÷ (block reward × 10¹² × 3.6·10⁶)
Here W / TH is watts per terahash, the ASIC's power draw divided by its hashrate. The 10¹² factor turns hashes into terahashes, and 3.6·10⁶ turns joules into kilowatt-hours.
How to read it
Price far above the lines
Mining pays even on older hardware. Miners don't need to sell what they mine to cover the power bill.
Price nearing a modern ASIC's line
Miners' margins get thin. Some may start selling reserves or switching off old machines.
Price below the lines
Mining on that hardware at that electricity price loses money. Historically such periods didn't last long, because weak miners switch off, difficulty drops, and the cost drops with it. But that's an observation about the past, not a rule.
Lines jumping at a halving
The block reward halves and the cost doubles overnight. On the chart it shows as a step up on the halving date.
Common mistakes
- Treating a line as a price floor. Costs differ between miners. Price can stay below a given ASIC's line for a long time.
- Forgetting the electricity price. One cent per kWh moves the line noticeably. Use a price that seems realistic to you.
- Comparing with price on short timeframes. Difficulty changes about every two weeks, so on 1m or 5m the line is almost flat and tells you nothing.
Try it yourself
- Open BTCUSDT, 1d, add BTC mining cost.
- Find the last halving. How did the gap between price and the lines change?
- Change the electricity price in the latest period to $0.04, then to $0.08. How far does the line move?
Not financial advice.