Funding: which part of the market pays for longs and which for shorts
What funding is
Perpetual futures never expire. To keep their price close to spot, the exchange regularly moves a payment from one side to the other.
- Positive rate: longs pay shorts. It happens when more traders want to buy with leverage.
- Negative rate: shorts pay longs. There are more leveraged sellers.
What it shows
Each coin falls into one of four groups by its current rate:
| Group | Funding rate | What it means |
|---|---|---|
| Strongly negative (red) | below −0.01% | shorts pay noticeably |
| Negative (orange) | −0.01% to 0 | shorts pay a little |
| Positive (light green) | 0 to 0.01% inclusive | longs pay a little |
| Strongly positive (green) | above 0.01% | longs pay noticeably |
The pane has four lines, one per group, on a 0 to 100% scale. Together the groups make up the whole market. You can change the line colours on the Style tab.
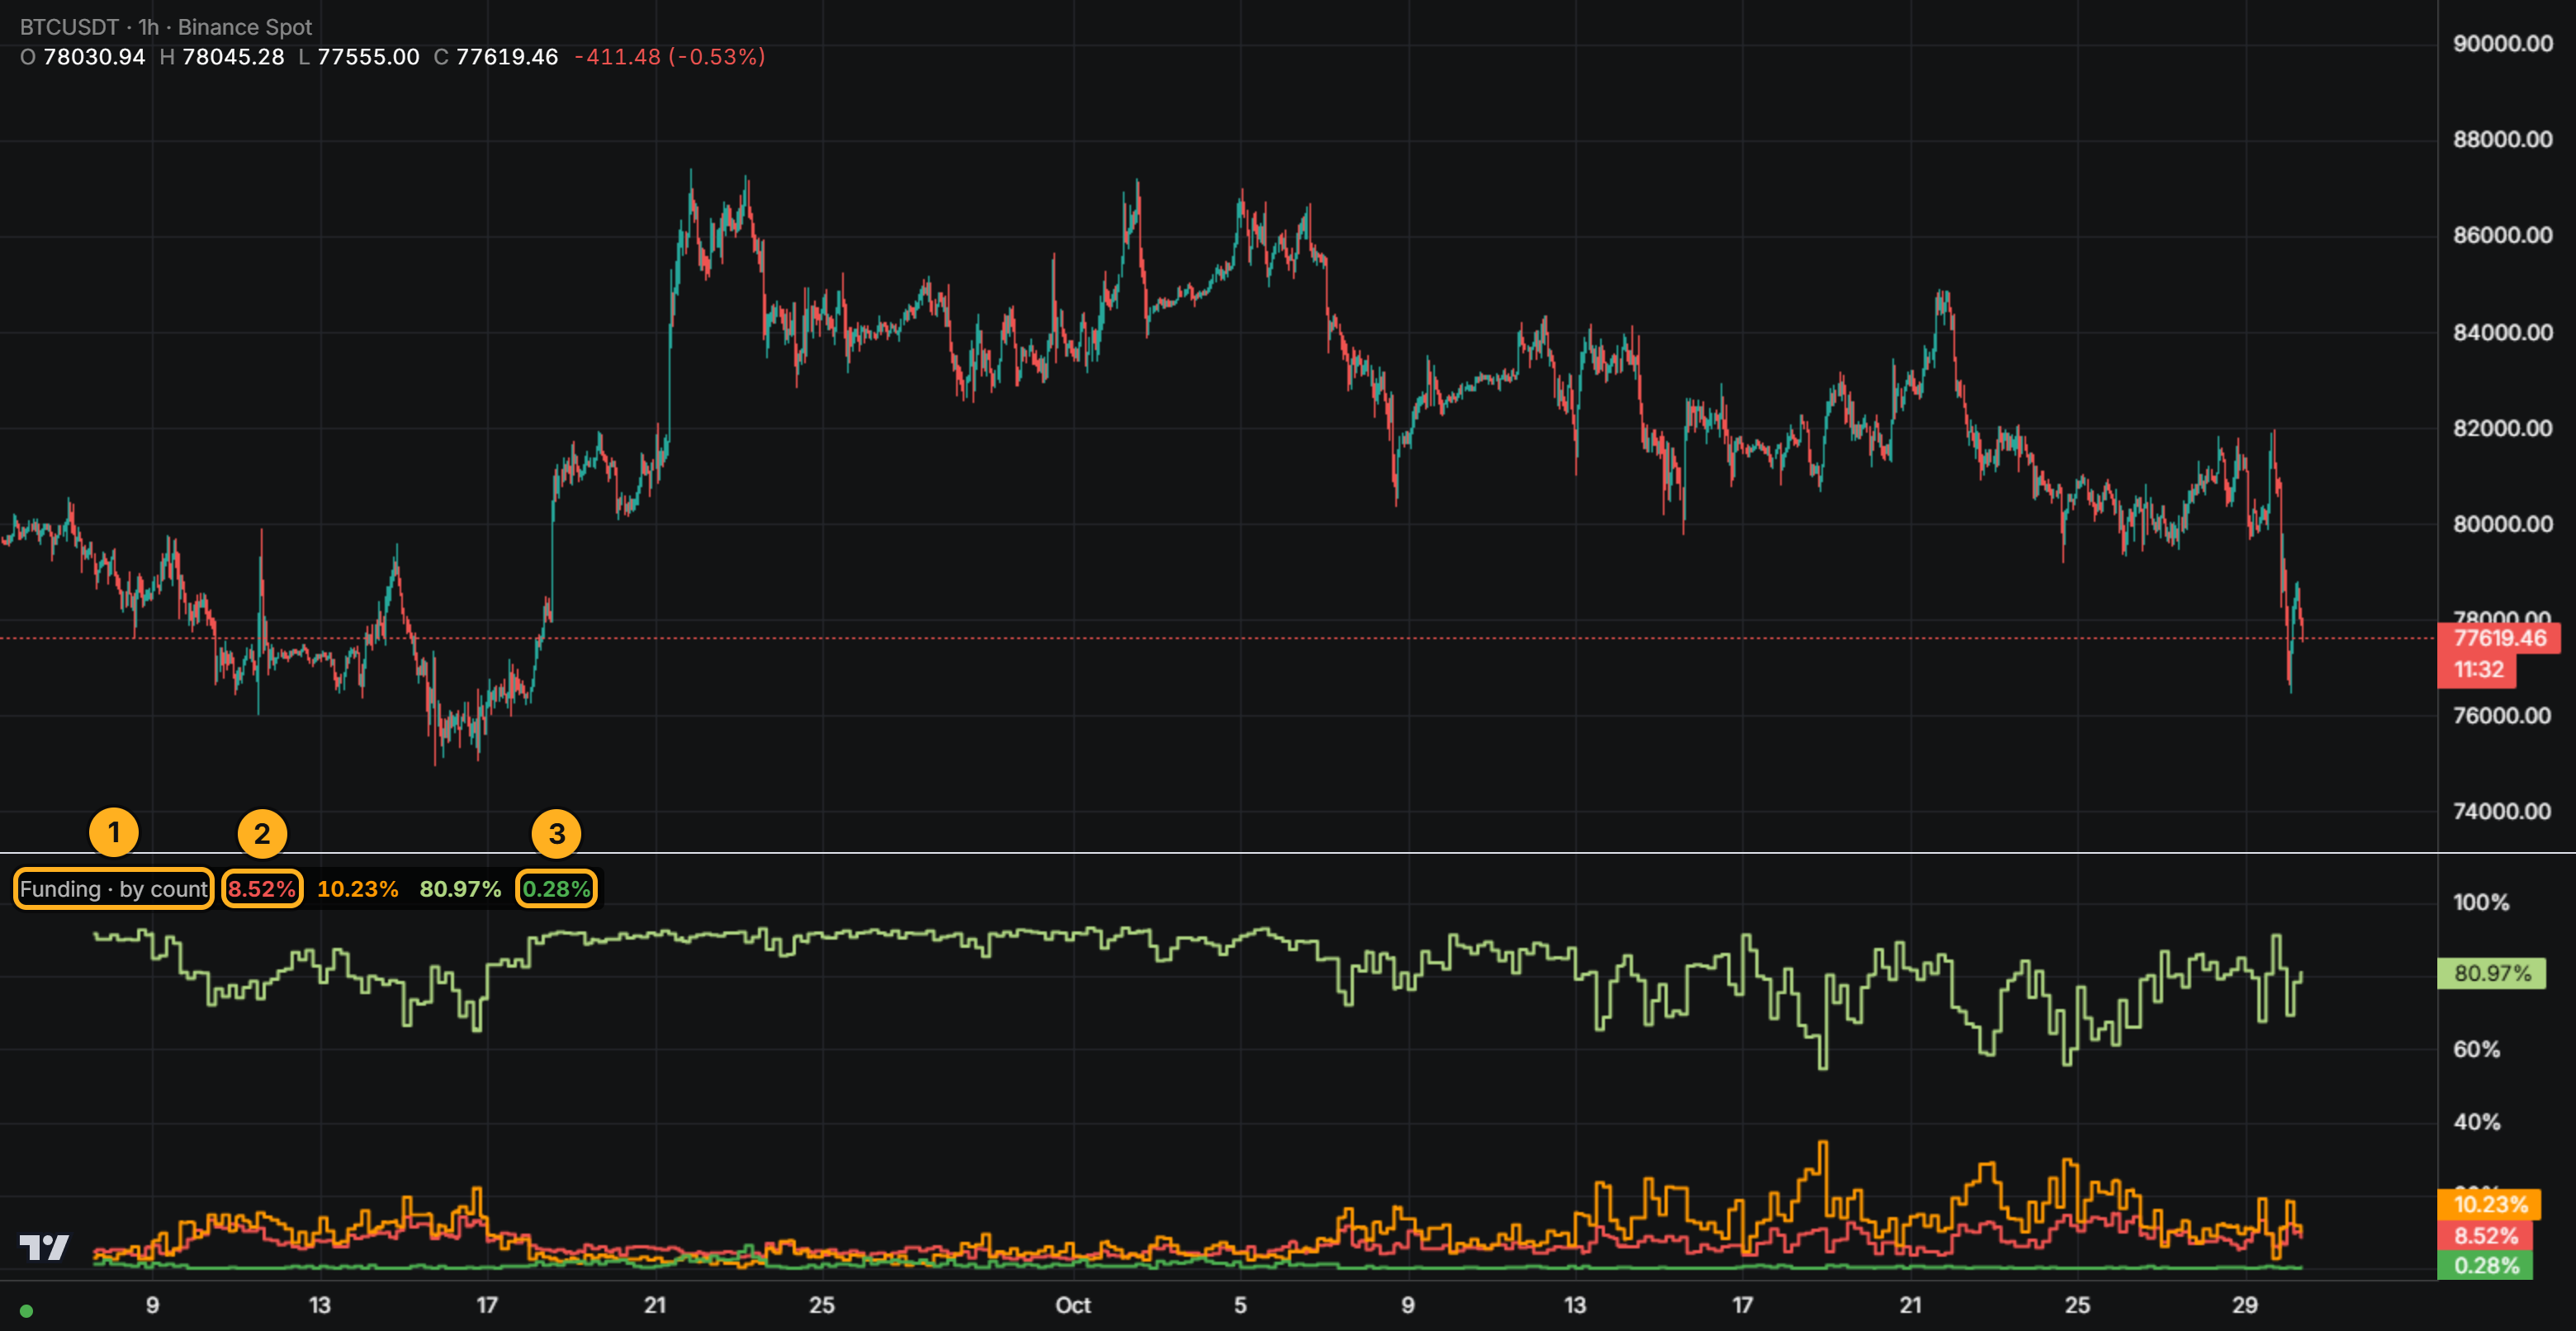
How to add it
- Open Chart. The coin doesn't matter, the data is the same for the whole market.
- Click Add indicator → Funding.
- On the Arguments tab, in the Weighting field, choose how to count the share:
- By count, by number of coins (default): every coin weighs the same;
- By OI, by Open Interest: a coin weighs as much as the money in its positions, so big coins count for more.
- Click Apply.
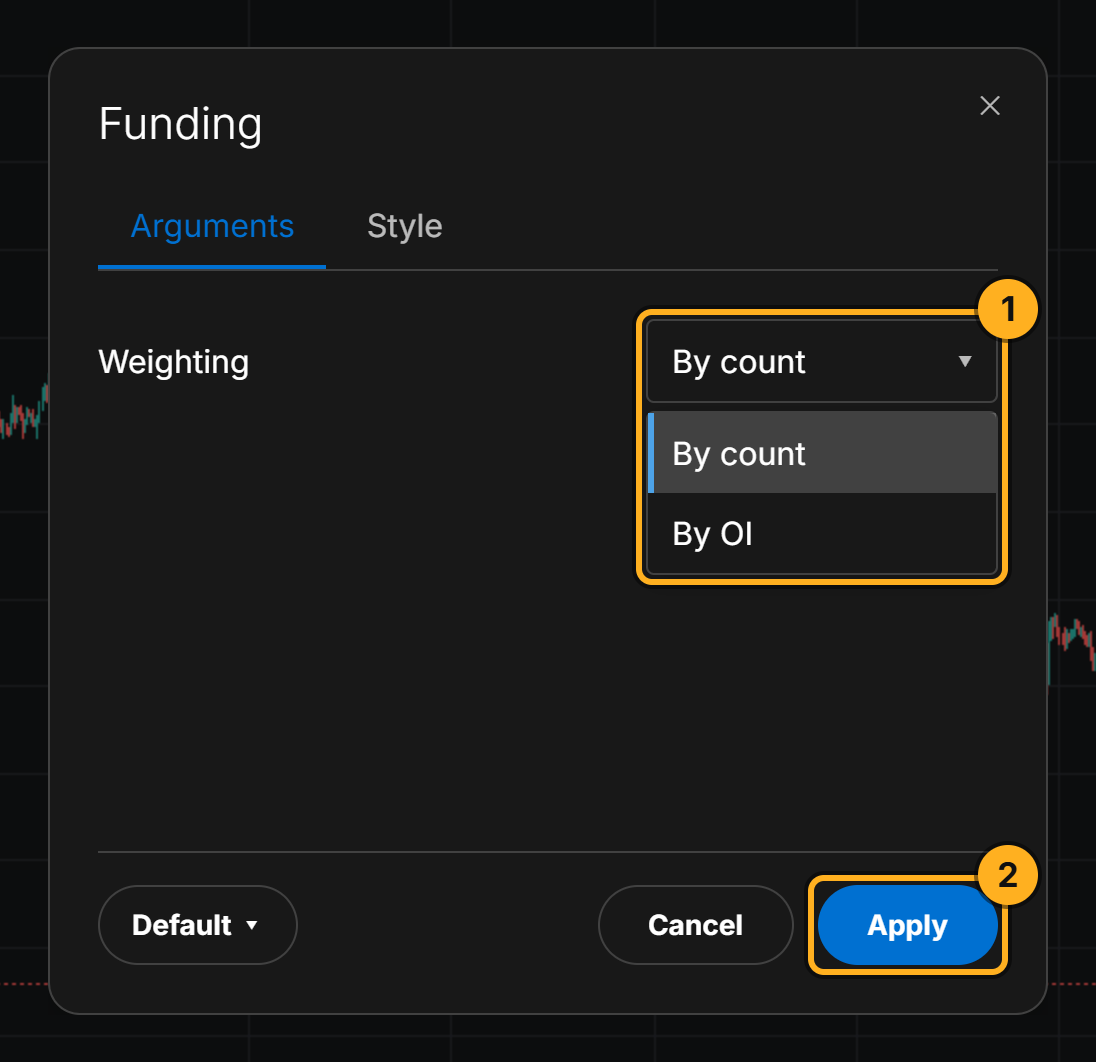
1 The Weighting field: By count or By OI. 2 Apply adds the pane.
How it is calculated
- The exchange settles funding every hour or less often. So on the 1h timeframe one candle is one settlement. On 1m, 5m and 15m the lines move in hourly steps. On 4h, 12h and 1d a candle shows the last settlement inside it.
- Rates are taken as the exchange sets them, not rescaled to 8 hours. Coins with different payment intervals land in groups by their actual rate.
How to read it
Strongly positive is growing
More and more coins where longs overpay. The market leans toward leveraged buying. When there are a lot of these coins, the market is exposed to a cascade of long liquidations.
Strongly negative is growing
More and more coins where shorts pay noticeably. The market is set up for a drop. A sharp move up at that point can squeeze the shorts.
Negative and Positive dominate
Rates are near zero, no lean either way.
Count and OI disagree
Strongly positive is big by number of coins but small by OI? Mostly small coins are overpaying, while the big money is calm. And the other way round.
Common mistakes
- Looking for one coin's rate. The indicator shows how the market is distributed, not the rate of a single coin.
- Reading a lean as an entry signal. A funding lean can last a long time. Check it against price, Open Interest and the order book in BID / ASK.
Try it yourself
- Add funding on any chart, 1h.
- Over a month, find the moment when Strongly positive was largest. What did the market do next?
- Switch the count to By OI and compare: same picture or a different one?
Not financial advice.